
|
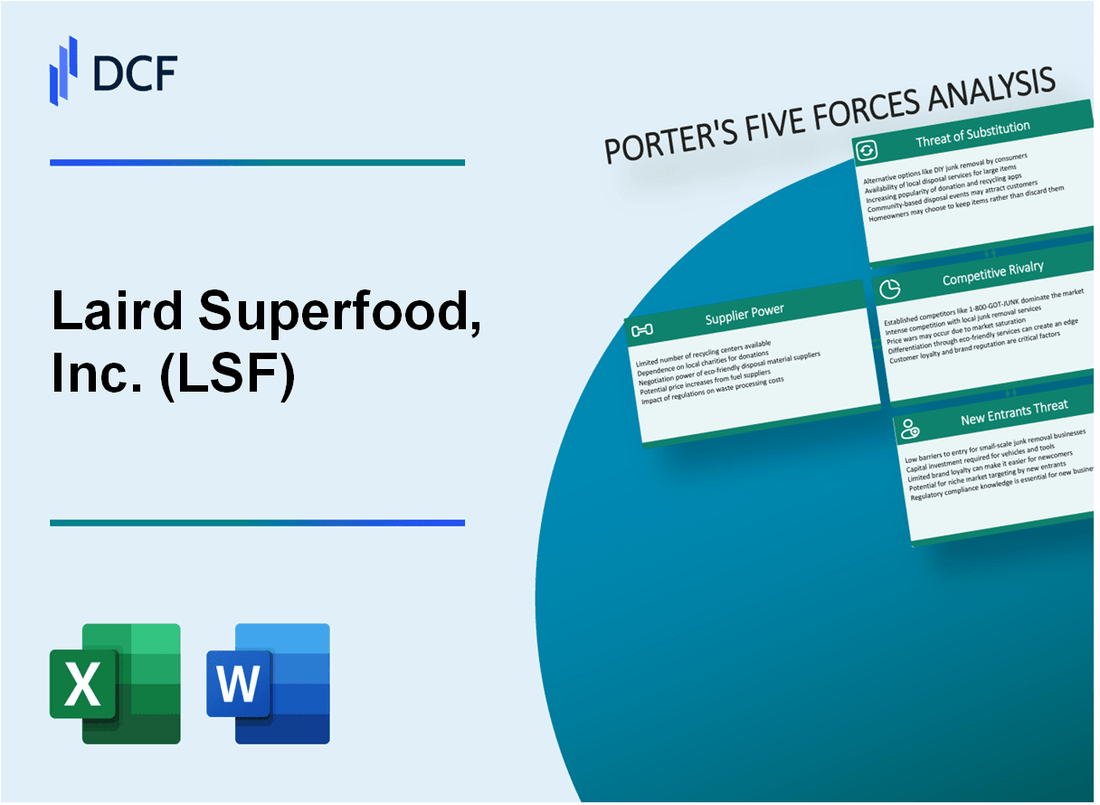
Laird Superfood, Inc. (LSF): 5 FORCES Analysis [Nov-2025 Updated] |
Fully Editable: Tailor To Your Needs In Excel Or Sheets
Professional Design: Trusted, Industry-Standard Templates
Investor-Approved Valuation Models
MAC/PC Compatible, Fully Unlocked
No Expertise Is Needed; Easy To Follow
Laird Superfood, Inc. (LSF) Bundle
You're looking at Laird Superfood, Inc.'s competitive standing as of late 2025, and frankly, the environment for this plant-based functional food company is proving tough. With a market capitalization barely scraping $28.91 million and commodity inflation squeezing the gross margin down to 36.5% in Q3, the near-term financial picture is tight, especially following a $1.0 million net loss that same period. Since wholesale accounts for 53% of their sales, giving major retailers serious leverage, you need a clear view of the five core forces shaping their market reality right now.
Laird Superfood, Inc. (LSF) - Porter's Five Forces: Bargaining power of suppliers
You're assessing the supplier landscape for Laird Superfood, Inc. (LSF) as we close out 2025, and the data clearly shows suppliers hold significant sway, primarily through input costs and ingredient specialization. The pressure from external factors is visible right on the income statement.
Commodity cost inflation and tariffs pressure Gross Margin, which contracted to 36.5% in Q3 2025. That's a sharp drop from the 43.0% seen in the third quarter of 2024. Honestly, management is working hard to offset this, projecting the full-year 2025 Gross Margin will land in the upper 30% range. This margin compression was explicitly attributed to increased commodity cost inflation and tariff costs, especially impacting key raw materials like coffee and coconut milk powder.
Here's a quick look at how these external cost factors are hitting the financials:
| Metric | Q3 2025 Value | Comparison/Context |
| Gross Margin | 36.5% | Contracted from 43.0% in Q3 2024 |
| Net Sales (Q3 2025) | $12.9 million | Up 10% year-over-year |
| Cash Position (Sep 30, 2025) | $5.3 million | No outstanding debt |
| Inventory Investment | Increased Year-to-Date | Driven partly to forward purchase raw materials to mitigate tariff costs |
Sourcing premium, traceable ingredients like organic coffee and functional mushrooms limits supplier options. Laird Superfood, Inc. emphasizes using real, whole, bioavailable ingredients, like the Maitake and Chaga mushrooms used for immune support. When you commit to that level of ingredient quality, your pool of qualified vendors shrinks, which naturally gives the remaining ones more leverage.
Suppliers of specialized ingredients have leverage due to Laird Superfood, Inc.'s focus on clean labels. Take Aquamin, for instance, a marine multimineral complex used in the Original Creamer. In North America, this ingredient is exclusively distributed by Stauber Performance Ingredients, Inc.. That exclusivity means Laird Superfood, Inc. must negotiate terms with a single channel partner for that specific, branded component. Similarly, the use of Medium Chain Triglycerides (MCTs) from coconuts points to reliance on specific suppliers for those healthy fats.
Also, the shift to an outsourced co-packing model reduces the company's internal manufacturing leverage. While management is actively partnering with co-packing partners to find cost savings to offset rising commodity costs, this structure inherently means Laird Superfood, Inc. gives up some control over production scheduling and internal cost absorption. The growing importance of the wholesale channel, which made up 53% of Q3 2025 Net Sales, further emphasizes the need for efficient, large-scale production, often best achieved through third-party manufacturing relationships.
The supplier power dynamic is shaped by these key dependencies:
- Reliance on single distributors for key functional ingredients like Aquamin.
- High exposure to global commodity price swings for coffee and coconut derivatives.
- Reduced internal manufacturing leverage due to the outsourced co-packing strategy.
- Need to forward purchase materials to mitigate anticipated tariff costs, tying up cash.
Finance: draft a sensitivity analysis on a 5% sustained increase in coffee bean costs by Friday.
Laird Superfood, Inc. (LSF) - Porter's Five Forces: Bargaining power of customers
The bargaining power of customers for Laird Superfood, Inc. remains a significant factor, shaped by channel concentration and the competitive nature of the functional food and beverage space.
The shift in revenue mix clearly elevates the power of large retail buyers. Wholesale channel dominance, representing 53% of Q3 2025 net sales, gives major retailers substantial leverage in negotiations regarding pricing, shelf placement, and promotional support. For context, total Q3 2025 Net Sales reached $12.9 million. This concentration is further highlighted by the fact that the top three customers accounted for 52% of Q3 sales.
Here's a quick look at the channel dynamics as of Q3 2025:
| Channel | Q3 2025 Sales Contribution | Year-over-Year Growth (Q3 2025) |
| Wholesale | 53% | 39% increase |
| E-commerce (DTC/Amazon) | 47% | 11% decrease |
The decline in the direct-to-consumer (DTC) portion of e-commerce sales, which fell by 11% year-over-year in Q3 2025, signals clear price sensitivity or potential brand fatigue among individual consumers who purchase directly. This contrasts sharply with the wholesale channel's 39% growth in the same period.
For the individual consumer, switching costs between competing plant-based creamer and hydration brands are generally low. The market is saturated with alternatives, and consumers can easily move between brands based on price or temporary promotions. For example, coffee creamers, Laird Superfood, Inc.'s largest product line at 60% of Q3 revenue, competes against established players offering oat, soy, and almond bases.
However, the founder's influence acts as a counter-lever:
- Laird Hamilton's strong personal brand equity, rooted in his status as a world-renowned big-wave surfer, helps maintain a premium price point for a segment of loyal consumers.
- The company is actively focusing investments on its core Laird Superfood brand, which includes coffee creamers and hydration enhancers, following the decision to discontinue the Picky Bars brand in Q2 2026.
- The company reported a positive Adjusted EBITDA of $0.2 million in Q3 2025, showing progress on operational efficiency despite the gross margin compression to 36.5% from 43.0% in Q3 2024.
Finance: review Q4 2025 wholesale order timing forecasts by next Tuesday.
Laird Superfood, Inc. (LSF) - Porter's Five Forces: Competitive rivalry
The functional food and beverage market is highly fragmented with numerous well-funded competitors. Laird Superfood is a small-cap player with a market capitalization of approximately $28.91 million as of mid-November 2025. Intense competition requires high marketing spend, contributing to a Q3 2025 Net Loss of $1.0 million. Rivals constantly innovate with new products, forcing Laird Superfood to launch new items like protein coffee.
The sheer scale of the competition is evident when you compare Laird Superfood, Inc.'s size to the overall market. The global functional food and beverage market was valued at an estimated $398.81 billion in 2025, with a projected Compound Annual Growth Rate (CAGR) of 10.33% through 2032. This environment demands significant investment just to maintain shelf presence.
You see this pressure reflected directly in the income statement. The drive to compete on product appeal and distribution means higher operating costs, which you can track against the top-line performance.
| Metric | Laird Superfood (LSF) Data (Late 2025) | Competitive Context Data |
|---|---|---|
| Approximate Market Capitalization | $28.91 million (as per outline); Search results range from $27.571M to $29.281M as of late November 2025. | N/A (Focus is on LSF's small-cap status relative to the market) |
| Q3 2025 Net Loss | $1.0 million (as per outline); More precisely reported as $975,066. | N/A (Direct financial impact of competition/spend) |
| Total Functional Food & Beverage Market Size (2025 Estimate) | N/A | $398.81 billion |
| Functional Beverage New Product Introductions (Last Year) | N/A | 258 new functional beverages introduced |
| Key Competitor Examples (Beverages) | N/A | PepsiCo, Red Bull, Danone, Monster Beverages, The Coca-Cola Company, Keurig Dr Pepper |
The need for continuous product development is not optional; it is a cost of entry. This rivalry forces Laird Superfood to allocate capital toward Research and Development and aggressive Sales and Marketing to fight for consumer attention against giants.
- Sales and marketing expenses rose 11% Year-to-Date (YTD) 2025 to $8.8 million.
- Laird Superfood branded product net sales increased 14% in Q3 2025.
- Coffee creamers represented 60% of Q3 revenue, showing high concentration in a competitive category.
- Wholesale sales increased 39% year-over-year in Q3 2025, driven by distribution gains.
This competitive pressure also impacts margins. When you have to spend more to sell, and commodity costs are rising, your gross profit suffers. Laird Superfood reported a Gross Margin of 36.5% in Q3 2025, down from 43.0% in the prior year period.
The competitive landscape is defined by these large, well-capitalized players who can sustain losses while innovating, which puts constant pressure on a smaller entity like Laird Superfood, Inc. Finance: draft 13-week cash view by Friday.
Laird Superfood, Inc. (LSF) - Porter's Five Forces: Threat of substitutes
You're looking at the competitive landscape for Laird Superfood, Inc. as of late 2025, and the threat of substitutes is definitely a major headwind, especially given the company's premium positioning and recent margin compression. The core of Laird Superfood, Inc.'s business-its creamers-faces direct, low-cost competition every day.
Traditional, cheaper dairy creamers and coffee additives are readily available and a major substitute for the core product line. This is critical because coffee creamers alone accounted for 60% of Laird Superfood, Inc.'s net sales in the third quarter of 2025. The pressure from these alternatives is evident in the company's financial performance; the Gross Margin fell to 36.5% in Q3 2025, a significant drop from 43.0% in the prior year period, largely due to commodity cost inflation and channel mix. That margin erosion suggests that Laird Superfood, Inc. either absorbed more cost or couldn't fully pass on price increases against cheaper options. Honestly, when your gross margin is under that kind of pressure, substitutes are winning somewhere.
Other functional beverages directly substitute Laird Superfood, Inc.'s hydration and wellness mixes. While Laird Superfood, Inc. is operating in a massive space-the global functional beverage market was estimated at $168.32 billion in 2025, with the US segment alone valued at $51.84 billion-the competition is fierce and well-capitalized. The intensity is shown by the April 2025 acquisition of Alani Nutrition by Celsius for a net purchase price of $1.65 billion. This signals that big players are willing to spend heavily to capture share in the wellness beverage category where Laird Superfood, Inc. competes.
Consumers can easily replicate the product benefits with basic ingredients like coconut oil and coffee, as the concept is defintely simple. This ease of replication means that for a consumer focused purely on the functional benefit of adding healthy fats or energy without the brand premium, the barrier to switching is low. The company's Q3 2025 net sales of $12.9 million missed analyst estimates of $14.3 million, which can happen when consumers opt for simpler, less expensive routines.
The company's focus on premium, functional benefits makes it vulnerable to lower-priced, mass-market alternatives. You see this vulnerability when you look at the overall economic climate; Laird Superfood, Inc. reported 'ongoing economic challenges for US consumers' in Q3 2025. While some consumers will pay a premium-for instance, 58% of consumers expressed interest in paying more for healthier carbonated soft drinks-that willingness doesn't automatically transfer to every functional category, especially for staple items like creamers. The company's wholesale channel grew 39% year-over-year in Q3 2025, but the direct-to-consumer e-commerce channel softened, with sales decreasing by 11%, suggesting price sensitivity might be higher when consumers buy direct.
Here's a quick look at the scale of the market versus Laird Superfood, Inc.'s recent performance:
| Metric | Value (2025) | Context |
|---|---|---|
| LSF Q3 Net Sales | $12.9 million | Actual Q3 2025 result |
| LSF Q3 Gross Margin | 36.5% | Q3 2025 result (down from 43.0% YoY) |
| LSF Coffee Creamer Revenue Share | 60% | Q3 2025 product mix |
| Global Functional Beverage Market Size | $168.32 billion | Estimated 2025 value |
| US Functional Beverage Market Size | $51.84 billion | Estimated 2025 value |
| Major Competitor Acquisition Value (Net) | $1.65 billion | Celsius acquisition of Alani Nutrition (April 2025) |
The threat is amplified by the fact that Laird Superfood, Inc. is managing a widening net loss, reported at $1.0 million in Q3 2025, compared to a $0.2 million loss the year prior. You need to watch that cash position, which stood at $5.3 million at the end of Q3 2025, against the ongoing operating losses.
The vulnerability is clear when you see the company's reliance on wholesale, which grew 39% year-over-year, while its e-commerce channel, often a place for premium brand building, saw sales decrease by 11%.
Finance: draft 13-week cash view by Friday.
Laird Superfood, Inc. (LSF) - Porter's Five Forces: Threat of new entrants
The barrier to entry in the functional food space for Laird Superfood, Inc. (LSF) is being actively lowered by operational choices the company itself has made. The strategic pivot to outsourcing manufacturing via co-packing significantly reduces the initial capital expenditure required for a new competitor to enter the market. Laird Superfood, Inc. previously shuttered its manufacturing facility in Sisters, Oregon, and moved to a co-packer agreement to reduce fixed overhead and simplify the business, a move intended to help reach a long-term gross margin target of 35%. This shift means a new entrant does not need to fund a large-scale production facility from day one.
Brand recognition, heavily tied to co-founder Laird Hamilton's name, remains a substantial, though not insurmountable, barrier. As of November 26, 2025, Laird Superfood, Inc.'s market capitalization stood at $27.86 million, which provides a tangible, albeit modest, measure of the current market valuation of that established brand equity. To put this in perspective against the broader industry, the global functional food market is estimated to be valued at USD 246.5 billion in 2025.
The success Laird Superfood, Inc. has seen in securing shelf space demonstrates that distribution access is achievable for well-capitalized newcomers. The company's wholesale channel saw net sales increase by 39% year-over-year in the third quarter of 2025, contributing 53% of total Net Sales for the period. Furthermore, year-to-date wholesale sales for the first nine months of 2025 increased by 40%.
The nature of the product category itself facilitates rapid customer migration. Low switching costs for consumers mean a new entrant can quickly gain traction with a differentiated or cheaper product. This is especially true when considering the company's Q3 2025 Gross Margin compressed to 36.5% from 43.0% in the prior year period.
Here's a quick look at Laird Superfood, Inc.'s recent top-line performance metrics:
| Metric | Q3 2025 Value | Year-over-Year Change |
| Net Sales | $12.9 million | +10% |
| Wholesale Sales Contribution | 53% of Net Sales | Wholesale Sales up 39% |
| Gross Margin | 36.5% | Down from 43.0% |
| Net Loss | $1.0 million | Up from $0.2 million loss |
The following factors summarize the immediate threat landscape for new entrants:
- Outsourcing manufacturing via co-packing lowers the initial capital expenditure barrier for new competitors.
- Brand recognition built on Laird Hamilton's name is a substantial, but not insurmountable, barrier to entry.
- The rapid growth of the wholesale channel (up 39% in Q3 2025) shows distribution access is achievable for new, well-capitalized brands.
- Low switching costs for consumers mean a new entrant can quickly gain traction with a differentiated or cheaper product.
Finance: draft a sensitivity analysis on the impact of a 500-basis-point margin compression on the breakeven Adjusted EBITDA target by next Tuesday.
Disclaimer
All information, articles, and product details provided on this website are for general informational and educational purposes only. We do not claim any ownership over, nor do we intend to infringe upon, any trademarks, copyrights, logos, brand names, or other intellectual property mentioned or depicted on this site. Such intellectual property remains the property of its respective owners, and any references here are made solely for identification or informational purposes, without implying any affiliation, endorsement, or partnership.
We make no representations or warranties, express or implied, regarding the accuracy, completeness, or suitability of any content or products presented. Nothing on this website should be construed as legal, tax, investment, financial, medical, or other professional advice. In addition, no part of this site—including articles or product references—constitutes a solicitation, recommendation, endorsement, advertisement, or offer to buy or sell any securities, franchises, or other financial instruments, particularly in jurisdictions where such activity would be unlawful.
All content is of a general nature and may not address the specific circumstances of any individual or entity. It is not a substitute for professional advice or services. Any actions you take based on the information provided here are strictly at your own risk. You accept full responsibility for any decisions or outcomes arising from your use of this website and agree to release us from any liability in connection with your use of, or reliance upon, the content or products found herein.