
|
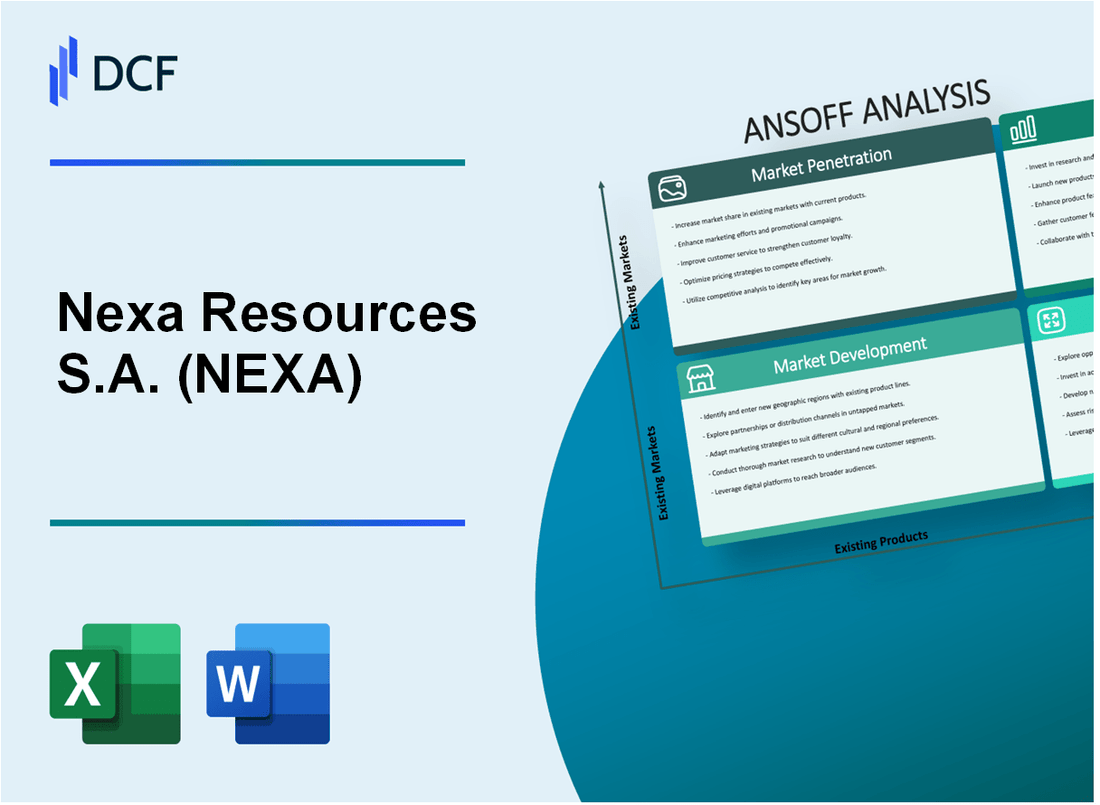
Nexa Resources S.A. (NEXA): ANSOFF MATRIX [Dec-2025 Updated] |
Fully Editable: Tailor To Your Needs In Excel Or Sheets
Professional Design: Trusted, Industry-Standard Templates
Investor-Approved Valuation Models
MAC/PC Compatible, Fully Unlocked
No Expertise Is Needed; Easy To Follow
Nexa Resources S.A. (NEXA) Bundle
You're looking at Nexa Resources S.A. (NEXA) and need to know exactly where the next dollar of growth is coming from, right? After two decades analyzing miners, I've distilled their game plan across the Ansoff Matrix-it's not just theory, it's actionable steps for 2025. We're talking about squeezing out a 3-5% bump in refined zinc production through better logistics right now, while simultaneously eyeing big moves like acquiring lithium assets or cracking the North American high-purity zinc market. This map shows you the near-term wins versus the longer-term, higher-risk plays, so you can see precisely how Nexa plans to navigate the metal cycle. Dive in to see the specific actions tied to each quadrant.
Nexa Resources S.A. (NEXA) - Ansoff Matrix: Market Penetration
You're looking at how Nexa Resources S.A. can push harder into the markets it already serves, primarily Brazil and Peru, using its existing metal products. This is about getting a bigger slice of the current pie, not finding new pie recipes or new bakeries.
The core of this strategy is volume and efficiency. For instance, in 2024, Nexa Resources S.A. recorded total zinc metal and oxide sales of 591kt, hitting the mid-range of its annual guidance. The 2025 full-year sales guidance for zinc metal and oxide is set between 560kt and 590kt. To achieve the upper end of this range, or exceed it, requires sharp execution on logistics and pricing in established territories.
To increase zinc sales volume in Brazil and Peru through optimized logistics and pricing, you need to look at recent performance benchmarks. Zinc metal and oxide sales in the fourth quarter of 2024 reached 152kt, an increase from 143kt in 4Q23. Furthermore, the third quarter of 2025 saw zinc metal and oxide sales hit 150kt. The company's total consolidated CAPEX guidance for 2025 remains at US$347 million, with sustaining investments in smelting set at US$89 million, which should support the necessary infrastructure for logistics improvements.
Offering volume discounts to key existing industrial clients, like galvanizers, is a direct way to capture greater share. While specific discount percentages aren't public, the sales figures show the potential target. For example, zinc metal sales alone in 2024 were 557kt. Securing a larger percentage of the demand from existing large-volume consumers directly impacts these top-line numbers. The company's 2024 Adjusted EBITDA was US$714 million, showing the profitability leverage available from increased volume.
Maximizing output at high-margin mines is crucial, aiming for a 3-5% increase in refined zinc production. Nexa Resources S.A.'s total smelting production of zinc metal and oxide reached 595kt in 2024. The company's 2025 guidance for zinc metal sales alone is 530kt to 555kt. In the mining segment, 2024 zinc production totaled 327kt. The third quarter of 2025 showed zinc production at 84kt, a 14% increase quarter-over-quarter, which suggests momentum in driving output.
Driving cost efficiencies in smelting operations helps undercut smaller regional competitors. The 2024 smelting conversion cost was US$0.30/lb, and the C1 cash cost was US$1.15/lb. For 2025, the assumed zinc price for cost guidance is US$1.24/lb. The 2025 smelting conversion cost guidance is expected to increase compared to 2024, so driving efficiencies beyond the guidance assumptions is key to gaining a competitive edge on price.
Focusing marketing efforts on the superior quality of refined metals to secure premium contracts is supported by the company's integrated model. In 2Q25, net revenues were US$708 million, and in 3Q25, they rose to US$764 million. The company's net leverage ratio at the end of 2024 was 1.7x, improving from 3.3x at the end of 2023, demonstrating financial strength that can back premium contract negotiations. The Cajamarquilla smelter, located in Lima, is noted as the largest smelter in the Americas.
Here is a look at the recent sales and production volumes for context:
| Metric | 2024 Actual | 2Q25 Actual | 3Q25 Actual | 2025 Guidance (Midpoint) |
| Zinc Metal & Oxide Sales (kt) | 591 | 145 | 150 | 575 |
| Total Smelting Production (kt) | 595 | 139 | 147 | N/A |
| Zinc Mining Production (kt) | 327 | N/A | 84 | N/A |
The operational performance in the latter half of 2025 shows potential for market share gains:
- Zinc metal and oxide sales in 3Q25 were 150kt.
- Zinc metal and oxide sales in 2Q25 were 145kt, a 12% sequential increase.
- Zinc production in 3Q25 was up 14% quarter-over-quarter.
- Adjusted EBITDA improved sequentially from US$161 million in 2Q25 to US$186 million in 3Q25.
- Net revenues grew from US$708 million in 2Q25 to US$764 million in 3Q25.
Finance: draft 13-week cash view by Friday.
Nexa Resources S.A. (NEXA) - Ansoff Matrix: Market Development
Nexa Resources S.A. has a stated medium-term ambition to expand boldly into new markets. This strategy focuses on taking existing products, like Special High Grade (SHG) zinc metal, which is registered on the London Metal Exchange (LME) and suitable for galvanizing and the chemical industry, into geographies or customer segments not currently maximized.
The company's 2025 sales guidance for zinc metal and oxide remains in the range of 560-590kt. For context, 3Q25 zinc metal and oxide sales were 150kt, contributing to Net Revenues of US$764 million in that quarter alone. The 2025 planning assumptions included a benchmark zinc price of US$1.24/lb. Total consolidated CAPEX guidance for the full-year 2025 is set at US$347 million.
The Market Development thrust involves several specific geographical and product-line extensions:
- Target new industrial markets in North America for high-purity zinc metal exports.
- Establish a sales presence in Southeast Asia, focusing on countries with growing infrastructure needs.
- Explore long-term supply agreements with European battery manufacturers for specialized zinc alloys.
- Leverage existing logistics networks to enter the Chilean or Argentinian mining supply chain.
- Assess the viability of selling byproducts, like sulfuric acid, to new regional chemical processors.
The scale of current operations provides the base for these market expansions. For instance, in 3Q25, mining operations produced 84kt of zinc, with the Aripuanã mine alone achieving a record 10.4kt. This output underpins the material available for developing these new market channels.
Consider the potential for byproduct monetization, such as sulfuric acid. While the global sulfuric acid market is projected to grow from USD 41.23 billion in 2025, Nexa Resources S.A.'s specific 2025 sulfuric acid sales volume or revenue is not explicitly detailed in the latest reports, but it is listed as a product alongside zinc and Zamac.
Here's a snapshot of key 2025 figures to frame the Market Development investment:
| Metric | Value (2025 Data) | Source/Context |
| 3Q25 Net Revenues | US$764 million | Reported for the third quarter of 2025. |
| 2025 Full-Year CAPEX Guidance | US$347 million | Total consolidated capital expenditure forecast. |
| 3Q25 Zinc Metal & Oxide Sales | 150kt | Volume sold in the third quarter of 2025. |
| 2025 Zinc Sales Guidance (Midpoint) | 575kt | Midpoint of the 560-590kt range for zinc metal and oxide. |
| 2025 Assumed Zinc Price | US$1.24/lb | Benchmark price used in 2025 guidance calculations. |
Developing new markets, especially for specialized products like zinc alloys for batteries or high-purity zinc for North America, requires capital allocation that must be weighed against the US$347 million total CAPEX guidance for 2025. The focus on expanding into new markets is a direct strategic lever to support long-term value creation.
Finance: draft 13-week cash view by Friday.
Nexa Resources S.A. (NEXA) - Ansoff Matrix: Product Development
You're looking at how Nexa Resources S.A. (NEXA) can grow by launching new products, which is the Product Development quadrant of the Ansoff Matrix. This means taking what you know-mining and smelting metals-and creating new offerings or significantly improving existing ones.
Invest in R&D to produce specialized zinc alloys for the electric vehicle (EV) battery market.
Specific financial figures for R&D dedicated solely to specialized zinc alloys for the EV market aren't public, but the overall investment framework is clear. Nexa Resources S.A. (NEXA) has a total Capital Expenditure (CAPEX) guidance for 2025 set at $347 million. Of this, the smelting segment, which would house alloy development, has a guidance of $89 million. Nexa S.A. (NEXA) also plans to invest $70 million in Exploration & Project Evaluation and Other Expenses for 2025, with $50 million allocated to mineral exploration expenses. This shows a commitment to capital deployment that supports future product streams.
Develop higher-grade copper and gold concentrates from existing mines like Aripuanã.
The focus here is on extracting more value from current ore bodies. The Aripuanã mine, for instance, demonstrated significant precious metal content in its reserves as of December 31, 2024. Proven and Probable Mineral Reserves at Aripuanã were estimated to contain 40.9 g/t Ag and 0.21 g/t Au. In 2024, the mine produced approximately 1,101.3 thousand ounces of silver and 14.0 thousand ounces of gold contained in concentrates. Furthermore, historical data shows a copper recovery rate of 67.2% at the Aripuanã process plant, which optimization efforts would aim to improve.
Introduce new, value-added zinc products for the agricultural sector, like micronutrients.
While specific sales data for new agricultural micronutrient products are not yet detailed, Nexa Resources S.A. (NEXA) is a recognized global producer of zinc oxide, a component used in various industrial and agricultural applications. The company's 2025 guidance for zinc metal and oxide sales is between 560-590 kilotonnes. Developing specialized zinc compounds for agriculture represents a move up the value chain from standard zinc oxide or metal sales.
Partner with technology firms to create traceable, sustainable metal products (green zinc).
Nexa Resources S.A. (NEXA) is actively pursuing sustainability enhancements that support a 'green' product narrative. In January 2025, Nexa Resources S.A. (NEXA) introduced its first fleet of hybrid (diesel-electric) loaders for underground mining in Peru, a move made in partnership with Ferreyros, explicitly supporting its decarbonization strategy. The company's 2024 Scope 1 and 2 carbon footprint was approximately 0.41 tons of CO2 equivalent per ton of commercialized zinc and zinc oxide, providing a baseline against which 'green' product premiums could be measured.
Optimize the smelting process to recover more precious metals (silver/gold) from existing ore.
Smelting process optimization directly impacts the recovery of by-products like silver and gold. In the third quarter of 2025, Nexa Resources S.A. (NEXA) reported that its smelting operations hit record volumes and contributed to a higher by-products contribution sequentially. This operational strength in the smelters, which include Cajamarquilla, Três Marias, and Juiz de Fora, is key to maximizing the value from the polymetallic concentrates it processes.
Here's a quick look at some relevant 2025 guidance and recent operational metrics that frame Product Development efforts:
| Metric Category | Item | Value / Guidance | Unit / Date Context |
| Financial Guidance | Total Consolidated CAPEX | $347 million | 2025 Guidance |
| Financial Guidance | Smelting CAPEX Allocation | $89 million | 2025 Guidance |
| Financial Guidance | Mineral Exploration Expenses | $50 million | 2025 Guidance |
| Operational Output | Aripuanã Gold Production | 14.0 thousand ounces | 2024 Actuals |
| Operational Output | Zinc Metal and Oxide Sales | 560-590kt | 2025 Guidance Range |
| Sustainability Baseline | Scope 1 & 2 Carbon Footprint | 0.41 tons CO2e/ton | Per commercialized zinc (2024 baseline) |
The Product Development strategy relies on translating these operational capabilities into marketable, higher-value outputs. You see the capital is being allocated, and the existing assets like Aripuanã are rich in silver and gold content that can be further refined or marketed differently.
- Investments support decarbonization, evidenced by the January 2025 hybrid loader fleet introduction with Ferreyros.
- Smelting segment saw record volumes and higher by-product contribution in 3Q25.
- Aripuanã reserves show significant silver content at 40.9 g/t.
- The company is one of the top five metallic zinc producers worldwide.
- The 2025 guidance for copper production anticipates a 10% decline compared to 2024.
If onboarding takes 14+ days, churn risk rises.
Finance: draft 13-week cash view by Friday.
Nexa Resources S.A. (NEXA) - Ansoff Matrix: Diversification
Acquire a controlling stake in a lithium or nickel project to enter the energy transition metals sector.
Nexa Resources S.A. has a 2025 consolidated Capital Expenditure guidance set at $347 million. Sustaining investments for 2025 are guided to be $316 million. The 2025 exploration investment target is $88 million, though a more detailed breakdown suggests mineral exploration expenses are guided at $50 million for 2025. The net debt at the end of the third quarter of 2025 stood at $1,479 million.
Invest in renewable energy generation (solar/wind) to power Nexa Resources S.A.'s operations and sell surplus.
Nexa Resources S.A. is recognized for its low-carbon zinc production, operating one of the world's largest zinc smelters, powered entirely by renewable hydroelectric energy. The company's CFO underscored integration of finance, ESG, and operations to drive sustainable growth, highlighting progress in renewable energy adoption in 2025. The Q3 2025 Net Income was reported at $100 million.
Purchase a downstream manufacturing facility that uses zinc, like a die-casting plant.
For 2025, sales guidance for zinc metal and oxide remains between 560kt and 590kt at the midpoint. In the third quarter of 2025, zinc metal and oxide sales totaled 150kt. The company's 2024 zinc production reached 327 kilotons.
Form a joint venture to develop a new mine in a politically stable region outside Latin America.
Nexa Resources S.A.'s Net debt/LTM Adjusted EBITDA ratio improved to 2.2x at the end of Q3 2025, down from 2.3x in the previous quarter. The company's Q3 2025 Adjusted EBITDA was $186 million.
Launch a dedicated environmental services division to manage mine tailings for other companies.
Project evaluation expense guidance for 2025 includes a project to extend the life of the tailings dam at the El Porvenir mine, set at $18 million within the total project evaluation expense guidance. Aripuanã achieved a record quarterly zinc production of 10.4kt in Q3 2025.
Here's a look at some key operational and financial metrics for Nexa Resources S.A. as of the third quarter of 2025:
| Metric | Value | Period/Context |
|---|---|---|
| Consolidated CAPEX Guidance | $347 million | Full Year 2025 |
| Net Income | $100 million | Q3 2025 |
| Net Revenues | $764 million | Q3 2025 |
| Adjusted EBITDA | $186 million | Q3 2025 |
| Net Debt | $1,479 million | End of Q3 2025 |
| Zinc Production | 84kt | Q3 2025 |
The strategic direction involves balancing core metal production with capital allocation toward future resilience:
- Sustaining investments for 2025 total $316 million.
- Mineral exploration budget for 2025 is $50 million.
- Zinc sales guidance for 2025 is 560kt-590kt.
- Copper production guidance for 2025 is expected to decline by 10% versus 2024.
- Lead production is expected to decrease by 7% in 2025.
Disclaimer
All information, articles, and product details provided on this website are for general informational and educational purposes only. We do not claim any ownership over, nor do we intend to infringe upon, any trademarks, copyrights, logos, brand names, or other intellectual property mentioned or depicted on this site. Such intellectual property remains the property of its respective owners, and any references here are made solely for identification or informational purposes, without implying any affiliation, endorsement, or partnership.
We make no representations or warranties, express or implied, regarding the accuracy, completeness, or suitability of any content or products presented. Nothing on this website should be construed as legal, tax, investment, financial, medical, or other professional advice. In addition, no part of this site—including articles or product references—constitutes a solicitation, recommendation, endorsement, advertisement, or offer to buy or sell any securities, franchises, or other financial instruments, particularly in jurisdictions where such activity would be unlawful.
All content is of a general nature and may not address the specific circumstances of any individual or entity. It is not a substitute for professional advice or services. Any actions you take based on the information provided here are strictly at your own risk. You accept full responsibility for any decisions or outcomes arising from your use of this website and agree to release us from any liability in connection with your use of, or reliance upon, the content or products found herein.