
|
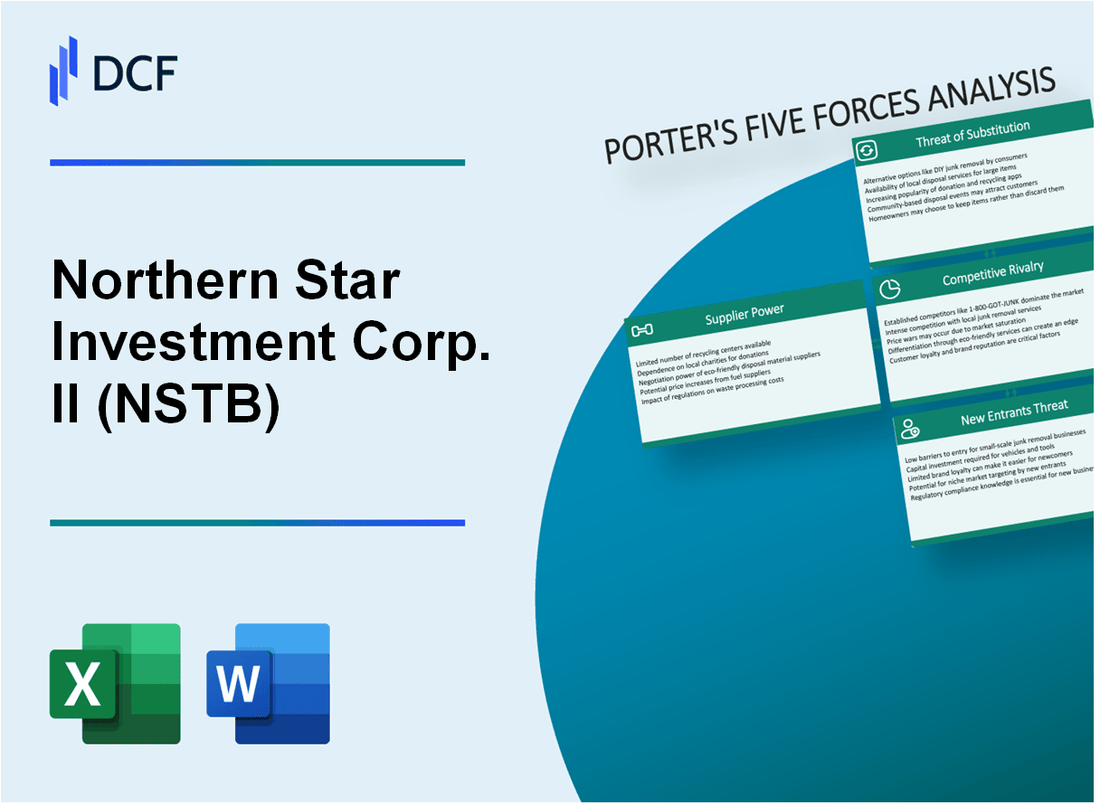
Northern Star Investment Corp. II (NSTB): 5 FORCES Analysis [Nov-2025 Updated] |
Fully Editable: Tailor To Your Needs In Excel Or Sheets
Professional Design: Trusted, Industry-Standard Templates
Investor-Approved Valuation Models
MAC/PC Compatible, Fully Unlocked
No Expertise Is Needed; Easy To Follow
Northern Star Investment Corp. II (NSTB) Bundle
You're looking at a $116.20 thousand market cap shell company, Northern Star Investment Corp. II, whose entire business model is now securing a non-traditional reverse merger after its prior deal collapsed and it settled with the SEC for a $1.5 million penalty. Honestly, this isn't your typical SPAC story; it's a deep dive into a vehicle trading on the OTC Pink sheets, where the power dynamics are completely inverted, especially since the trust distribution was pegged around $10.48 per share. We need to map out exactly who holds the cards-from the scarce legal advisors to the target companies holding near-absolute leverage-by running it through Porter's Five Forces framework right now, in late 2025. The game has changed.
Northern Star Investment Corp. II (NSTB) - Porter's Five Forces: Bargaining power of suppliers
You're trying to assess the leverage Northern Star Investment Corp. II (NSTB) has over the specialized professionals it needs to complete a business combination, and honestly, the deck is stacked against the shell company right now. The suppliers here aren't just vendors; they are gatekeepers to the de-SPAC process itself.
High-quality legal and financial advisors are scarce and expensive for complex, distressed shell mergers. For a typical mid-market M&A deal in 2025, success fees for advisory firms often fall in the 3% to 5% range, depending on the deal size and structure. Furthermore, for specialized legal work related to distressed or non-traditional transactions, hourly rates for experienced financial advisors in major metro areas are reported to range from $120 per hour up to $300 per hour as of 2025. These costs are upfront or heavily weighted toward success, meaning NSTB needs significant cash to secure top talent.
Investment banks and auditors hold strong power, demanding premium fees for a non-traditional transaction structure like a SPAC merger. While standard M&A success fees can be in the low single digits on large transactions, the complexity and regulatory scrutiny of a SPAC unwinding or merger often push fees higher or necessitate substantial retainer payments to cover initial due diligence and regulatory filings. Auditors, in particular, command premium rates to sign off on the financial statements of a shell company attempting a complex transaction, especially one that has seen significant stock price volatility, such as NSTB's movement from a 52-week high of $10.7 down to its current trading level near $0.0100.
The sponsor team, which is the management group, is a critical, non-substitutable supplier of expertise and deal sourcing. Their power is structurally embedded in the SPAC model. Historically, the sponsor's main compensation, the promote, is structured to equal 25% of the IPO shares, which they purchase for a nominal fee. Their initial capital contribution to the SPAC, often placed in trust, typically ranges from 2% to 8% of the total capital raised in the IPO. This inherent equity stake gives them significant leverage in negotiating the terms of the final business combination, as they control the deal sourcing and execution expertise.
The current market reality for Northern Star Investment Corp. II severely limits its ability to use equity as a bargaining chip. The stock price is critically low, trading at approximately $0.0100 as of late 2025, with a day low/high of $0.01 in recent trading periods. This near-zero valuation drastically reduces the value of any stock-based compensation offered to suppliers, forcing the company to rely almost entirely on cash payments. Compounding this, the reported trading volume is extremely low, with recent figures showing a volume of only 300 shares and an average volume of 901 shares, indicating severe illiquidity. This lack of liquid stock value means suppliers demand higher cash retainers or success fees to compensate for the inability to be paid in a meaningful equity stake.
Here is a quick look at the cost pressures on a SPAC like Northern Star Investment Corp. II:
- Typical Financial Advisor Hourly Rate (2025): $120 to $300
- Typical Mid-Market M&A Success Fee (2025): 3% to 5%
- Sponsor Initial Investment as % of IPO Proceeds: 2% to 8%
- Sponsor Promote Equity Stake (Historical Benchmark): 20% of post-IPO shares
- Northern Star Investment Corp. II (NSTB) Stock Price (Late 2025): $0.0100
- Northern Star Investment Corp. II (NSTB) 52-Week Low: $0.01
The power dynamic is further illustrated by how compensation is structured for the critical deal-sourcing team. The sponsor's ability to secure a target is tied to their substantial promote, but the shell's ability to pay other necessary service providers is hampered by its balance sheet status, which is characterized by having no significant operations.
| Supplier Category | Power Driver | Financial Implication/Data Point |
| Legal & Financial Advisors | Scarcity for distressed/complex SPAC deals | Hourly rates up to $300; Success fees tied to deal value |
| Investment Banks & Auditors | Non-traditional transaction structure risk | Demand for premium retainers over low-value stock compensation |
| Sponsor Team (Management) | Non-substitutable deal sourcing/expertise | Entitled to a structural promote, historically 20% of IPO equity |
| Cash vs. Stock Payment | NSTB's low stock price and liquidity | Stock value near $0.01; Volume as low as 300 shares |
If onboarding takes 14+ days for a critical legal opinion, the risk rises because the cash burn continues while the stock price remains near $0.01. Finance: draft the 13-week cash view by Friday to ensure sufficient liquidity for any required upfront retainers.
Northern Star Investment Corp. II (NSTB) - Porter's Five Forces: Bargaining power of customers
You're evaluating Northern Star Investment Corp. II as a potential acquisition vehicle, and the customer power-in this case, the potential merger target-is exceptionally high right now. This isn't a traditional SPAC scenario where you're negotiating against the clock with a ticking trust fund. Northern Star Investment Corp. II has already liquidated its cash trust, which fundamentally shifts the negotiation dynamic.
Target companies hold near-absolute power, as Northern Star Investment Corp. II offers only a public listing, not a cash trust. The company announced its determination to liquidate the trust account, distributing approximately \$10.48 per share to holders of its 1,620,989 outstanding public shares as of early 2024. What this means for a potential partner is that Northern Star Investment Corp. II can no longer offer the substantial cash-in-trust that SPACs typically provide for a business combination. Instead, Northern Star Investment Corp. II can only offer a public listing vehicle, which is a much weaker proposition for a high-quality target.
The company's prior failed merger and \$1.5 million SEC settlement give targets leverage in negotiations. The Securities and Exchange Commission (SEC) charged Northern Star Investment Corp. II with making misleading statements in its January 2021 Initial Public Offering (IPO) regarding pre-IPO discussions with a target. The settlement requires a \$1.5 million penalty, but only in the event Northern Star Investment Corp. II successfully closes a future merger transaction. Furthermore, the history includes terminating a definitive merger agreement with Apex Clearing Holdings in November 2021. This baggage-the regulatory scrutiny and the history of a failed deal-provides a target with significant talking points to press for more favorable terms.
The target avoids dilution from a large trust and retains more control, increasing their power. Consider the starting point: the original IPO in January 2021 priced 35,000,000 units at \$10.00 per unit, raising \$350,000,000. Now, without that large, guaranteed cash component from the trust, the target company has more room to negotiate equity structure and governance, effectively retaining more control over the combined entity's future capitalization table and operational direction.
Trading on the OTC Pink sheets, not a major exchange, significantly diminishes the value proposition to a high-quality target. Following the trust liquidation, Northern Star Investment Corp. II expects to be delisted from the NYSE American and continue trading on the OTC Pink sheets (OTCMKTS) as a shell entity. A listing on a major exchange like the NYSE or Nasdaq is a key value driver for many SPACs; trading on the OTC Pink sheets suggests a much lower profile and potentially less investor interest, which weakens Northern Star Investment Corp. II's pitch to a premium business looking for a prestigious public debut.
Here's a quick look at the structural shift impacting customer power:
| Metric | Pre-Liquidation (SPAC Status) | Post-Liquidation (Shell Status as of late 2025 Estimate) |
|---|---|---|
| Cash Component Offered | Trust Value (Approx. \$10.48 per share in Jan 2024) | None (Listing only) |
| Primary Listing Venue | NYSE American (Prior to delisting) | OTCMKTS (Pink Sheets) |
| Potential Regulatory Liability | Contingent \$1.5 million SEC penalty | Contingent \$1.5 million SEC penalty |
| Original IPO Proceeds | \$350,000,000 | N/A (Funds distributed) |
The current structure forces any potential partner to value Northern Star Investment Corp. II almost entirely on its public listing status and the management team's ability to secure a new financing vehicle, like a PIPE (Private Investment in Public Equity), rather than on a pre-funded trust. This is a defintely tough spot for the shell to be in when negotiating with a desirable target.
The bargaining power of customers is further defined by the limited immediate upside for shareholders, which can translate to management being more aggressive to close any deal, though the lack of a trust makes the deal less attractive overall. The company's ability to attract a high-quality target is severely constrained by the following factors:
- No cash in trust to fund the transaction.
- History of a failed merger with Apex Clearing.
- SEC settlement of \$1.5 million hanging over the closing.
- Trading on the OTC Pink sheets, not a major exchange.
Finance: draft a sensitivity analysis on the required PIPE size for a \$500 million valuation target, assuming a 20% discount to market price, by next Tuesday.
Northern Star Investment Corp. II (NSTB) - Porter's Five Forces: Competitive rivalry
The competitive rivalry facing Northern Star Investment Corp. II (NSTB), especially in its current iteration as a post-liquidation shell, is intense. You are competing in a market saturated with similar vehicles, all vying for the attention of a limited pool of quality private operating companies seeking a public listing.
High rivalry exists among a glut of distressed SPACs and liquidated shells seeking deals in late 2025.
The market is characterized by a large supply of shells. While Northern Star Investment Corp. II (NSTB) liquidated its trust account in early 2024, distributing $10.48 per share to holders of its 1,620,989 remaining public shares, it made the unusual choice to continue operating as a shell on the pink sheets. This decision places it in direct competition with other shells that may have retained better capital structures or more favorable exchange listings. The overall SPAC market saw a rebound, with 81 new SPAC IPOs tracked by one firm as of August 20, 2025, up from 57 for all of 2024. However, this competition is not without casualties; nearly 20% of SPACs led by well-known sponsors still faced liquidation in 2025.
Competition from low-priced stock creates a race to the bottom for merger valuation.
The market sentiment has crushed valuations for deals that have closed. For many targets, the perceived value of a public listing via a shell is severely depressed compared to the peak years. The sheer volume of low-priced equity floating around, including the 11.62 million shares associated with NSTB, forces any remaining shell to offer highly attractive terms to a potential merger partner. The data shows that the median performance for de-SPAC transactions in 2025 reflects a steep decline of about 75% from the standard $10 IPO price. This environment pressures sponsors to accept lower implied valuations for their targets just to get a deal across the finish line.
You need to understand the landscape of the competition you are up against:
- Redemption Pressure: Approximately 95% of SPAC funds have been redeemed in closed deals in 2025.
- Valuation Hurdle: Over 90% of completed SPAC mergers trade below the initial $10 offer price as of early May 2025.
- Post-Liquidation Status: NSTB is now trading on the pink sheets, a less desirable venue than the NASDAQ, where most new 2024 SPACs listed.
Direct competition from other established shell vehicles that have retained better liquidity or exchange listings.
NSTB's move to liquidate its trust means it can only offer a public listing, not the built-in cash trust that was the primary attraction for targets in earlier years. This immediately puts it at a disadvantage against shells that still hold significant trust value or maintain listings on major exchanges. The competition is fierce among vehicles that can offer a more robust platform. For context on the overall market:
| Metric | 2021 Peak (Context) | 2024 Activity | 2025 YTD (Partial) |
|---|---|---|---|
| SPAC IPOs (Count) | 613 | 57 | Close to 100 (Q1-Q3) |
| SPAC IPO Proceeds (USD) | N/A (63% of all IPOs) | $9.6 billion | Approx. $20,760 million (Q1-Q3) |
| Post-Merger Trading (Below $10) | N/A | N/A | Over 90% (as of May 2025) |
The management team's reputation is a key differentiator against other sponsor groups in a crowded, low-quality field.
Reputation matters, and for Northern Star Investment Corp. II (NSTB), the history is a clear headwind. The company settled charges with the Securities and Exchange Commission (SEC) for material misrepresentations in its IPO disclosures, agreeing to pay a $1.5 million penalty contingent on closing a merger. This regulatory action, stemming from pre-IPO discussions with a target, directly impacts the perceived trustworthiness of the sponsor group when negotiating with a prospective private company. While the failed merger with Apex Fintech Solutions-which had a valuation struck at $4.7 billion-was terminated, the subsequent SEC settlement creates a significant hurdle when trying to differentiate your shell from others in a field where investors are now much more discerning.
Northern Star Investment Corp. II (NSTB) - Porter's Five Forces: Threat of substitutes
For Northern Star Investment Corp. II (NSTB), which continues its corporate existence as a shell trading on the OTC Pink sheets following its trust liquidation, the threat of substitutes for its intended business combination-a de-SPAC transaction-is substantial and multifaceted as of late 2025.
A traditional Initial Public Offering (IPO) remains the gold standard substitute for quality private companies. While the SPAC route is often marketed as faster, a traditional IPO typically takes 12-18 months to complete, compared to the 3-6 months average for a SPAC merger, though the actual combined timeline can blur. The cost structure also differs; IPO underwriting spreads average between 7% for deals under $100 million and 5-6% for larger transactions. Still, the credibility and market-driven price discovery of a successful IPO draw high-quality targets away from shell vehicles like Northern Star Investment Corp. II (NSTB). In Q1 2025 alone, global traditional IPOs raised $29.3 billion across 291 deals, signaling a robust, albeit volatile, alternative path.
Direct listings offer a simpler, less-dilutive path to public markets for mature, well-known targets. While direct listings avoid the underwriting fees and sponsor promote dilution inherent in a SPAC IPO, the market trend in 2022-2025 shows that companies opting for this route have generally been microcap stocks. For instance, companies like Cloudastructure and Functional Brands utilized this path in 2025, suggesting it is less of a threat to a large, growth-oriented target that might otherwise seek a SPAC. The key difference in first-day return calculation-from the offer price in an IPO versus the opening trade in a direct listing-further separates the investor experience.
Private equity or venture capital funding provides capital without the regulatory burden of a public shell merger. This substitute is powerful because private capital pools are deep. S&P reported that total uncommitted capital, or dry powder, reached a record $2.62 trillion in July 2024, creating immense pressure for deployment. Furthermore, secondary market transaction volume reached $160 billion in 2024, indicating that liquidity is increasingly being found privately, keeping companies private for longer. For a target company, staying private allows it to avoid the scrutiny that Northern Star Investment Corp. II (NSTB) faced, including the $1.5 million SEC settlement it agreed to in January 2024.
Target companies can use other, less-damaged shell companies with cleaner histories and better public market access. Northern Star Investment Corp. II (NSTB) itself is an example of a shell with a complicated history, having liquidated its trust and now trading on the OTC Pink sheets, which limits access to more prestigious exchanges. In contrast, sister SPACs like Northern Star III and IV were delisted from the NYSE and sought a Nasdaq listing prior to or in connection with a merger. The market saw 122 new SPAC IPOs in 2025, raising $25.19 billion, with an average raise of $205.2 million, meaning targets have many other, potentially cleaner, vehicles to choose from.
| Substitute Path | Key Metric/Data Point (Late 2025 Context) | Relevance to NSTB Threat Level |
|---|---|---|
| Traditional IPO Timeline | Average execution time of 12-18 months. | High: Offers a more established, credible route, though slower. |
| SPAC IPO Capital Raised (2025 YTD) | $25.19 billion raised across 122 IPOs. | Medium: Indicates capital is flowing to new SPACs, bypassing older shells. |
| Private Market Dry Powder | Record $2.62 trillion as of July 2024. | High: Significant capital available privately, reducing the need to go public. |
| Direct Listing Profile | Companies listing via this route have generally been microcap stocks (2022-2025). | Low to Medium: Less of a threat for a large, established target seeking significant capital. |
| NSTB Post-Liquidation Status | Trades on the OTC Pink sheets. | High: Inferior listing venue compared to NYSE/Nasdaq, making cleaner shells more attractive. |
The competitive landscape for a target company is defined by these trade-offs:
- Traditional IPOs: 12-18 month timeline vs. SPAC speed.
- Direct Listings: Simpler structure, but often for microcap firms.
- Private Capital: $2.62 trillion in dry powder available privately.
- Alternative Shells: Many new 2025 SPACs with cleaner records available.
- Litigation Risk: De-SPACs face a 17% likelihood of an SCA vs. 13% for new IPOs.
Finance: draft updated risk assessment on OTC listing discount by Friday.
Northern Star Investment Corp. II (NSTB) - Porter's Five Forces: Threat of new entrants
You're analyzing the threat of new entrants into the business of Northern Star Investment Corp. II (NSTB) as a post-liquidation shell entity. The barrier to entry here isn't starting from scratch with an Initial Public Offering (IPO); it's about acquiring an existing, publicly-listed vehicle. Honestly, the landscape is shaped by both new issuance and the recycling of old ones.
New SPAC formation has definitely picked up steam in 2025 after the lull of 2023-2024, but the market is still seeing shell companies created through the liquidation of older SPACs, like what happened with Northern Star Investment Corp. II. As of November 24, 2025, the market saw 122 SPAC IPOs year-to-date, raising \$25,037.9 million in gross proceeds. This contrasts with the 57 IPOs in all of 2024. Still, when a SPAC like Northern Star Investment Corp. II liquidates its trust, the remaining corporate shell can be acquired, offering a shortcut to the public markets for a new sponsor.
The main cost barrier for a traditional SPAC-the trust capital-is effectively removed for an acquirer of a shell like Northern Star Investment Corp. II. When Northern Star Investment Corp. II liquidated its trust in early 2024, the distribution to public shareholders was approximately \$10.48 per share. This means the primary asset backing the initial public float is gone, but the public listing structure remains. The sponsor and officers waived their right to this distribution, leaving the retained shares as the basis for a potential future transaction.
Here's a quick look at the capital dynamics influencing new entrants:
| Metric | Value (as of late 2025/YTD) | Context |
|---|---|---|
| Northern Star Investment Corp. II Trust Distribution (Historical) | \$10.48 per share | The cost basis distributed to original public shareholders. |
| 2025 YTD SPAC IPO Gross Proceeds | \$25,037.9 million | Indicates renewed capital flow into new SPACs. |
| 2025 YTD SPAC IPO Count | 122 | Shows a resurgence in new formation activity. |
| Serial Sponsor Lead in 2025 IPOs (Q2-2025) | 80% | New entrants face competition from experienced teams. |
| Northern Star Investment Corp. II Post-Liquidation Price (Example) | \$0.010 | Illustrates the low market valuation of a post-trust shell. |
Regulatory changes create a shifting landscape that affects every potential new entrant, whether they launch a new SPAC or acquire a shell. The SEC finalized new rules that became effective July 1, 2024, with enhanced Inline XBRL tagging requirements starting June 30, 2025. These rules specifically target de-SPAC transactions to align them more closely with traditional IPO disclosures.
The key regulatory shifts impacting new entrants include:
- Enhanced disclosure on sponsor compensation.
- Mandatory disclosure of conflicts of interest.
- New requirements regarding dilution analysis.
- Rule 145a deeming the transaction a sale of securities.
- Increased liability exposure for projections used.
New sponsors can enter the market by acquiring existing, cheaper shell entities like Northern Star Investment Corp. II, which has already navigated the initial listing process and is now trading on the OTC Pink. This path bypasses the current regulatory scrutiny applied to new SPAC IPOs, though the subsequent de-SPAC transaction will still fall under the new rules. The low trading price of \$0.010 for NSTB as of late 2025 suggests a very low acquisition cost for the corporate shell itself, assuming the sponsor can negotiate a deal that retains the public shareholders. If onboarding takes 14+ days, churn risk rises, but for a shell acquisition, the speed of a reverse merger is the key advantage over a fresh IPO.
Disclaimer
All information, articles, and product details provided on this website are for general informational and educational purposes only. We do not claim any ownership over, nor do we intend to infringe upon, any trademarks, copyrights, logos, brand names, or other intellectual property mentioned or depicted on this site. Such intellectual property remains the property of its respective owners, and any references here are made solely for identification or informational purposes, without implying any affiliation, endorsement, or partnership.
We make no representations or warranties, express or implied, regarding the accuracy, completeness, or suitability of any content or products presented. Nothing on this website should be construed as legal, tax, investment, financial, medical, or other professional advice. In addition, no part of this site—including articles or product references—constitutes a solicitation, recommendation, endorsement, advertisement, or offer to buy or sell any securities, franchises, or other financial instruments, particularly in jurisdictions where such activity would be unlawful.
All content is of a general nature and may not address the specific circumstances of any individual or entity. It is not a substitute for professional advice or services. Any actions you take based on the information provided here are strictly at your own risk. You accept full responsibility for any decisions or outcomes arising from your use of this website and agree to release us from any liability in connection with your use of, or reliance upon, the content or products found herein.