
|
Outbrain Inc. (OB): ANSOFF MATRIX [Dec-2025 Updated] |
Fully Editable: Tailor To Your Needs In Excel Or Sheets
Professional Design: Trusted, Industry-Standard Templates
Investor-Approved Valuation Models
MAC/PC Compatible, Fully Unlocked
No Expertise Is Needed; Easy To Follow
Outbrain Inc. (OB) Bundle
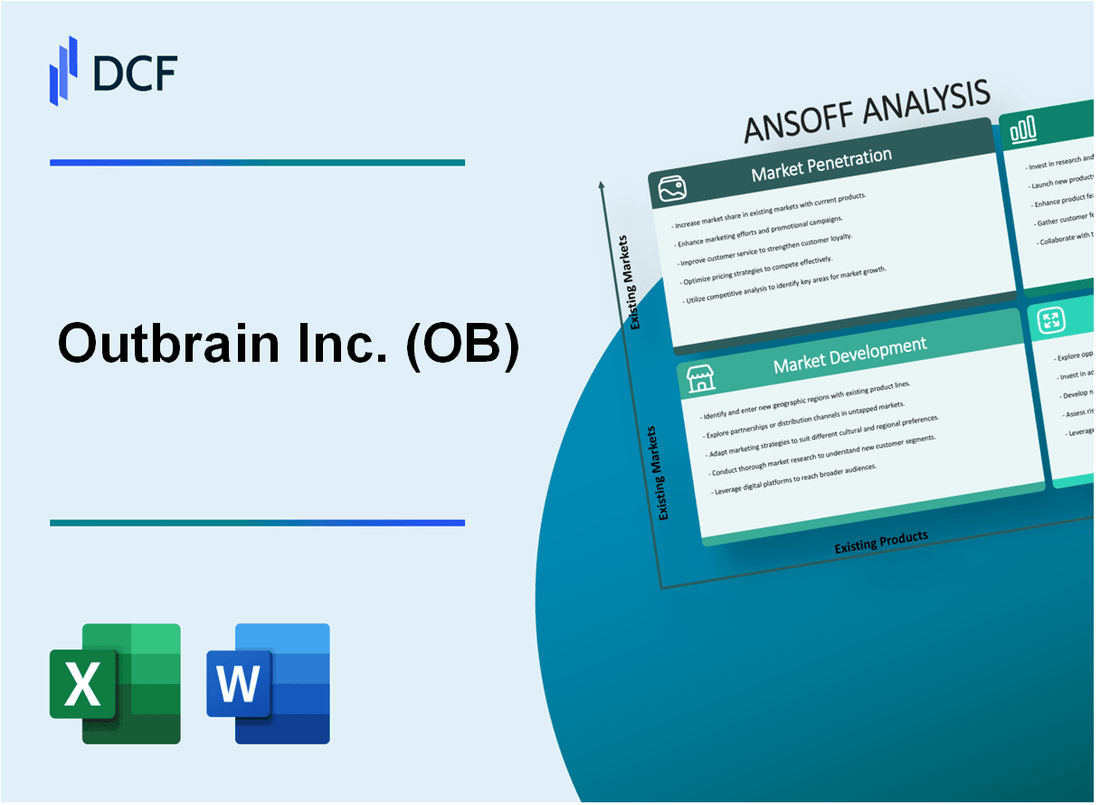
You're looking at a company that's clearly signaling confidence, backed by a full-year 2025 Adjusted EBITDA guidance of at least $180 million following the Teads integration. Honestly, that kind of target demands more than just vague goals; it needs a precise roadmap for turning combined scale into superior returns. As an analyst who's mapped out growth strategies for decades, I find the Ansoff Matrix the perfect tool here to distill their four distinct paths-from digging deeper into current markets to making aggressive new channel bets like Connected TV. Keep reading to see the concrete actions they're planning for Market Penetration, Development, Product, and Diversification to hit that number.
Outbrain Inc. (OB) - Ansoff Matrix: Market Penetration
You're looking at how Outbrain Inc. (now operating under the Teads brand following the February 2025 acquisition) plans to squeeze more revenue from its existing customer base-the core of Market Penetration strategy. This is about selling more of what you already have to the people who already know you.
The immediate focus is on cross-pollination between the legacy customer sets. You see initial traction here, with the plan to accelerate cross-selling of legacy Outbrain performance tools directly into the legacy Teads enterprise brand customer base. Honestly, this started right in Q2 2025, with several campaigns already sold as soon as the integration kicked off. This effort is supported by new strategic Joint Business Partnerships (JBPs) signed with major players like Ferrero, Haleon, Philip Morris International, and Beiersdorf, which provide immediate avenues for expanded sales.
The financial muscle for these publisher incentives and growth initiatives is being directly funded by the expected efficiencies from the merger. Management has raised the expected cost synergy benefit for the full year 2025 to approximately $40 million. To be fair, this is a significant near-term boost, especially since about 90% of the compensation-related synergy actions-a major component of the total-were already actioned by Q1 2025. The full run-rate target for cost synergies is set to hit ~$60 million annually by 2026.
Deepening platform integration across the existing publisher footprint is key to driving better performance metrics, which in turn supports higher spend from advertisers. The combined Teads platform now maintains direct partnerships with over 10,000 publishers globally. This scale is where you drive the next level of performance.
Here's a quick look at the high-value advertiser segment you are targeting for increased annual spend:
| Metric | Value |
|---|---|
| Number of Largest Advertisers Targeted | ~500 |
| Minimum Annual Spend for Target Group (Rolling 12 Months) | $0.5 million |
| Average Annual Spend for Target Group | Over $2 million |
| Percentage of Total Customer Spend Represented by Target Group | ~70% |
Driving higher RPMs (Revenue Per Mille, or revenue per thousand impressions) is the direct result of better targeting and inventory utilization. You can see this already playing out in the Connected TV (CTV) segment, which saw growth of 100% year-over-year in Q1 2025, now accounting for approximately 5% of total ad spend. Also, the new Moments vertical video offering, which brings social media-style engagement, is live on over 70 publishers, helping to lift overall inventory value.
The Market Penetration efforts rely on these levers:
- Initial cross-sell campaigns launched in Q2 2025.
- Focus on increasing spend from the ~500 largest advertisers.
- Realizing $40 million in 2025 cost synergies.
- Leveraging the platform across over 10,000 publishers.
- Driving growth in premium inventory like CTV, which grew 100% YoY in Q1 2025.
Finance: draft 13-week cash view by Friday.
Outbrain Inc. (OB) - Ansoff Matrix: Market Development
You're looking at how Outbrain Inc., now operating as Teads following the February 3, 2025, acquisition, plans to take its existing omnichannel platform into new territories and customer segments. This is Market Development in action. The combined entity reported a trailing twelve-month revenue of $1.18B as of September 30, 2025. The immediate post-merger results show strong momentum supporting this expansion effort.
The strategy involves pushing the full-funnel brandformance solution into new geographies. While specific emerging Asia-Pacific revenue contribution for 2025 isn't broken out, the company is actively managing existing international renewals, including Wabija in France and Sunkei in Japan in Q1 2025. The overall open internet market is estimated at a $175 billion opportunity.
Targeting new advertiser verticals is happening alongside the push into new regions. The current advertiser base shows that approximately 70% of total customer spend comes from about 500 advertisers spending over $0.5 million on a rolling 12-month basis, averaging over $2 million annually. This heavy reliance on large enterprise spend signals a clear opportunity to develop the mid-market segment, which is currently underserved by enterprise-focused solutions.
Joint Business Partnerships (JBPs) are a key mechanism for entering new media ecosystems. In the first quarter of 2025, the company announced new strategic JBPs with major brands like Ferrero, Haleon, Philip Morris International, and Beiersdorf. These partnerships help validate and scale the platform's reach across different media environments.
Converting the existing publisher base to higher-margin formats is critical for financial leverage. The 'Moments' vertical video solution is a prime example of a premium format driving adoption. Over 70 publishers have adopted Moments, with users consuming eight videos on average per engagement session. This format is delivering close to 80% viewability for branding campaigns, nearly doubling the engagement rate of other branding formats.
Here's a quick look at the financial uplift seen in Q1 2025, which provides the fuel for these development efforts:
| Metric | Q1 2025 Value (USD) | Year-over-Year Change |
| Revenue | $286.4 million | 32% increase |
| Gross Margin | 28.9% | Up from 19.2% |
| Ex-TAC Gross Margin | 36.0% | Up from 24.0% |
| Adjusted EBITDA | $10.7 million | 665% increase |
| CTV Ad Spend Contribution | Approx. 5% of total ad spend | Over 100% YoY growth (pro forma) |
The Market Development focus areas include:
- Expand omnichannel platform into emerging Asia-Pacific markets.
- Target B2B and government advertiser verticals with the brandformance solution.
- Leverage JBPs with partners like Ferrero and Haleon for ecosystem entry.
- Introduce the combined platform to mid-market advertisers.
- Convert more publisher base to higher-margin, premium ad formats like Moments.
The company expects to realize a benefit from cost synergies of approximately $40 million for the full year 2025. Finance: draft 13-week cash view by Friday.
Outbrain Inc. (OB) - Ansoff Matrix: Product Development
You're looking at the next steps for Outbrain Inc., now operating as Teads following the February 2025 acquisition. Product development here is about scaling new formats and integrating advanced technology across the existing base of over 10,000 publishers globally.
Roll out the Moments vertical video product to the remaining ~9,930 publishers not yet live with the offering.
The global launch of Moments, which began beta testing in Q3 2024, is slated for 2025. As of the first quarter of 2025, the offering was live on over 70 publishers, including partners like Axel Springer and Fox News. This represents a significant push to roll out the immersive video experience to the remaining target of approximately ~9,930 publishers. The focus is on bringing this social media-style engagement to trusted, premium environments on the open internet.
Early performance data from the beta, studied by MediaScience, shows strong user engagement:
| Metric | Value | Comparison/Context |
| Average Videos Consumed Per Session | 3.2 | Reported in beta testing. |
| Average Attention on Moments Experience | 14.6 seconds | Compared to 3.4 seconds for high-impact display experiences. |
| Brand Recall Improvement | 56% higher | Compared to digital ads alone. |
| Brand Recognition Improvement | 47% higher | Compared to digital ads alone. |
| Unaided Brand Recall Lift (Moments + Social) | 87% lift | When combined with social media ads. |
Integrate predictive AI across the platform to create new automated creative and campaign optimization tools.
The combined Teads entity is explicitly focused on leveraging predictive AI technology to connect media, creative, and measurement. This is already evident in the Outbrain DSP (formerly Zemanta), which features an Autopilot mechanism. This sophisticated AI analyzes hundreds of campaign parameters and adjusts bids in real time to react to market fluctuations throughout the day, allowing users to input budgets and Key Performance Indicators (KPIs) for automated management. The platform also uses an AI-powered CTR predictor to estimate click probability in real time for better creative placement.
Develop new ad formats for the open internet that mimic social media engagement but maintain premium context.
Moments is the primary example here, designed to bring the 'familiar and engaging' format of vertical video from social platforms to quality publisher sites. The goal is to transform static article real estate into engaging vertical video feeds with easy swipeable navigation. This strategy is a direct response to the trend where vertical viewing has become the norm, with less than 30% of users turning their mobile device horizontally. The format is positioned to attract ad investment to the open internet by offering a solution that keeps ad density low for a premium user experience.
Launch a self-service platform for smaller advertisers, building on the Outbrain DSP (Zemanta) capabilities.
The Outbrain DSP, formerly known as Zemanta, is the foundation for this self-service offering. Advertiser spend on the Outbrain DSP grew by approximately 45% in Fiscal Year 2024 compared to the prior year. The platform already offers centralized programmatic media buying, from planning to optimization, through its intuitive dashboard. Key features supporting this include integration with first-party analytics like Adobe or Google Analytics for measuring on-site engagement, and fully transparent reporting on media, data, and third-party service costs.
Invest in new measurement and attribution products to prove ROI for brand advertisers.
The shift in the market is toward data-driven outcomes, pushing spend toward performance-centric metrics, especially in a post-cookie environment. Outbrain is actively using attention metrics as a key KPI. For instance, the Outbrain Onyx ad placements receive an Attention Unit score (AU) indicating the probability of attention. A specific pre-roll video ad campaign using Outbrain Onyx placements on premium sites resulted in an impressive 41% uplift in attention compared to benchmarks. Furthermore, one client, AdRizer, delivered a 180% Return on Ad Spend (ROAS) for the organic skin brand, Ogee, by utilizing a suite of metrics via Outbrain.
For financial context on the overall business supporting these investments, Q1 2025 Revenue was $286.4 million, a 32% increase year-over-year, incorporating the Teads acquisition. The company is projecting a full year 2025 Adjusted EBITDA of at least $180 million and expects to realize cost synergies of approximately $40 million for the year 2025.
- Total debt obligations as of March 31, 2025, were $627.0 million.
- Cash, cash equivalents, and short-term investments totaled $155.9 million as of March 31, 2025.
- Connected TV (CTV) spend grew by more than 100% year-over-year in Q1 2025 and now represents approximately 5% of total ad spend.
- Approximately 70% of total customer spend comes from approximately 500 advertisers spending at least a half a million dollars on a rolling 12-month basis, with an average spend over $2 million annually.
Outbrain Inc. (OB) - Ansoff Matrix: Diversification
You're looking at the most aggressive growth quadrant here, moving into new media channels and new service categories. For Outbrain Inc., now operating under the Teads brand following the February 2025 acquisition, this is about leveraging scale to capture spend outside its traditional native recommendation base.
Aggressively expand the Connected TV (CTV) offering. This isn't just a hope; it's a demonstrated growth engine. In Q1 2025, CTV revenue grew by more than 100% year-over-year on a pro forma basis. That momentum is key, but it still represents only approximately 5% of total ad spend as of that quarter. The immediate action is scaling that from 5% toward a more significant portion of the total advertising pie. This expansion is directly supported by the Teads combination, which brought significant digital video and CTV know-how.
The acquisition of Teads itself is the primary diversification move, costing a total consideration of approximately $900 million, which included $625 million in cash and 43.75 million shares of common stock. This move diversifies the business mix toward higher-margin video inventory. The company is targeting at least $180 million in Adjusted EBITDA for the full year 2025, showing confidence in the combined entity's profitability ramp. Furthermore, cost synergies are tracking ahead, with approximately 90% of the estimated compensation-related synergies already actioned as of Q1 2025, contributing to the expected $60 million in cost synergies by 2026 run-rate.
Develop a proprietary data management platform (DMP) to offer first-party data solutions to advertisers outside of ad serving. While I don't have a specific dollar amount tied to a new DMP launch yet, the foundation is in place. The merger created a combined data set designed to power expanded contextual, audience, and purchase-based targeting capabilities, connecting CTV experiences to digital moments. This is the raw material for any future data product. Honestly, the immediate focus seems to be on cross-sell and synergy realization, but the data scale is defintely there.
Acquire a specialized ad-tech firm in the audio or gaming space to enter new media channels. There are no public figures yet for a specific audio or gaming acquisition, but the strategic rationale is clear: to become the end-to-end platform across all screens. The current focus is on integrating the video/CTV strength gained from the Teads deal. You can see the immediate strategic wins with more than 50 Joint Business Partnerships (JBPs) signed, including major advertisers like Ferrero, Haleon, Philip Morris International, and Beiersdorf.
Create a publisher-facing subscription or paywall management service, leveraging their deep publisher relationships. The core mission remains helping publishers get the most value out of their content, but the reported financial focus is on ad revenue optimization. The platform already supports publishers with technology for content discovery, aiming for sustainable value. The current scale includes access to more than 300,000,000 TV screens globally through exclusive partnerships with OEMs like LG and Vida.
Launch a new B2B SaaS product for media owners focused on content monetization and audience analytics. The existing technology stack, which includes 127 active machine learning algorithms for content personalization, provides the backbone for such a product. The platform infrastructure supports approximately 340,000 monthly active publishers as of 2023, representing a massive installed base for any new monetization tool. The company's AI engine processes over one billion predictions each minute.
Here's a quick look at the key numbers supporting this diversification strategy:
| Metric | Value / Rate | Reporting Period / Context |
| CTV YoY Growth | 100%+ | Q1 2025 |
| CTV Share of Ad Spend | ~5% | Q1 2025 |
| Teads Acquisition Cost | $900 million | Completed February 2025 |
| Teads Acquisition Cash Component | $625 million | Part of Total Consideration |
| FY 2025 Adjusted EBITDA Target | At least $180 million | Full Year 2025 Guidance |
| Projected 2026 Cost Synergies | ~$60 million | Annualized Run-Rate |
| Compensation Synergy Actions Taken | ~90% | As of Q1 2025 |
| Total JBPs Secured | >50 | As of Q1 2025 |
The strategic elements driving this diversification include:
- Access to Teads' specialty in digital video and CTV advertising inventory.
- The combined entity reaching over 2 billion consumers per month.
- The platform's AI engine processing over one billion predictions each minute.
- The goal to serve advertisers across the full funnel, from branding to performance.
- The combined data set powering expanded contextual and audience targeting.
Finance: draft the Q2 2025 budget revision incorporating the expected synergy realization by end of next month.
Disclaimer
All information, articles, and product details provided on this website are for general informational and educational purposes only. We do not claim any ownership over, nor do we intend to infringe upon, any trademarks, copyrights, logos, brand names, or other intellectual property mentioned or depicted on this site. Such intellectual property remains the property of its respective owners, and any references here are made solely for identification or informational purposes, without implying any affiliation, endorsement, or partnership.
We make no representations or warranties, express or implied, regarding the accuracy, completeness, or suitability of any content or products presented. Nothing on this website should be construed as legal, tax, investment, financial, medical, or other professional advice. In addition, no part of this site—including articles or product references—constitutes a solicitation, recommendation, endorsement, advertisement, or offer to buy or sell any securities, franchises, or other financial instruments, particularly in jurisdictions where such activity would be unlawful.
All content is of a general nature and may not address the specific circumstances of any individual or entity. It is not a substitute for professional advice or services. Any actions you take based on the information provided here are strictly at your own risk. You accept full responsibility for any decisions or outcomes arising from your use of this website and agree to release us from any liability in connection with your use of, or reliance upon, the content or products found herein.