
|
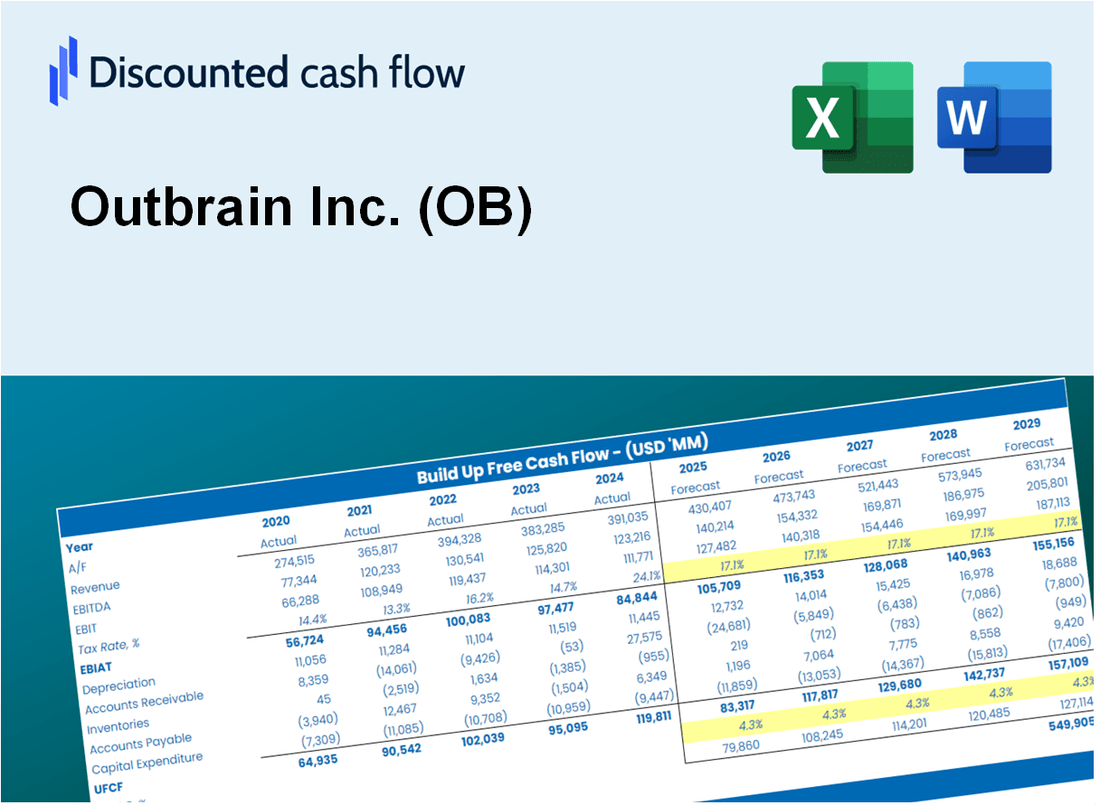
Outbrain Inc. (OB) DCF Valuation |
Fully Editable: Tailor To Your Needs In Excel Or Sheets
Professional Design: Trusted, Industry-Standard Templates
Investor-Approved Valuation Models
MAC/PC Compatible, Fully Unlocked
No Expertise Is Needed; Easy To Follow
Outbrain Inc. (OB) Bundle
Explore Outbrain Inc.'s (OB) financial potential with our user-friendly DCF Calculator! Enter your projections for growth, margins, and expenses to calculate Outbrain Inc.'s (OB) intrinsic value and enhance your investment approach.
What You Will Get
- Real OB Financials: Access to historical and projected data for precise valuation.
- Customizable Inputs: Adjust WACC, tax rates, revenue growth, and capital expenditures as needed.
- Dynamic Calculations: Intrinsic value and NPV are computed automatically.
- Scenario Testing: Evaluate various scenarios to assess Outbrain's future performance.
- User-Friendly Design: Crafted for professionals while remaining approachable for newcomers.
Key Features
- Comprehensive Outbrain Financials: Gain access to precise pre-loaded historical data and future forecasts.
- Adjustable Forecast Parameters: Modify yellow-highlighted fields such as WACC, growth rates, and profit margins.
- Real-Time Calculations: Automatic updates for DCF, Net Present Value (NPV), and cash flow assessments.
- Interactive Dashboard: User-friendly charts and summaries to help visualize your valuation outcomes.
- Suitable for All Skill Levels: An easy-to-navigate structure designed for investors, CFOs, and consultants alike.
How It Works
- 1. Download the Template: Obtain and open the Excel file containing Outbrain Inc.'s (OB) financial data.
- 2. Adjust Key Inputs: Modify essential parameters such as growth projections, WACC, and capital spending.
- 3. Analyze Results in Real-Time: The DCF model automatically computes intrinsic value and NPV based on your inputs.
- 4. Explore Different Scenarios: Evaluate various forecasts to understand a range of valuation possibilities.
- 5. Present with Assurance: Share expert valuation findings to enhance your decision-making process.
Why Choose This Calculator for Outbrain Inc. (OB)?
- Designed for Industry Experts: A sophisticated tool utilized by financial analysts, investors, and marketing strategists.
- Comprehensive Data: Outbrain’s historical and forecasted financials integrated for precision.
- Flexible Scenario Analysis: Effortlessly test various projections and assumptions.
- Transparent Results: Automatically computes intrinsic value, NPV, and essential financial metrics.
- User-Friendly: Detailed instructions walk you through every step of the calculation.
Who Should Use Outbrain Inc. (OB)?
- Digital Marketers: Enhance your campaigns with data-driven insights from a leading content recommendation platform.
- Content Creators: Increase your audience reach by leveraging Outbrain's extensive distribution network.
- Publishers: Optimize revenue through tailored monetization strategies and analytics.
- Advertisers: Drive targeted traffic and maximize ROI with advanced targeting options.
- Researchers and Analysts: Gain valuable industry insights and trends to inform your strategies.
What the Template Contains
- Historical Data: Includes Outbrain Inc.'s (OB) past financials and baseline forecasts.
- DCF and Levered DCF Models: Detailed templates to calculate Outbrain Inc.'s (OB) intrinsic value.
- WACC Sheet: Pre-built calculations for Weighted Average Cost of Capital.
- Editable Inputs: Modify key drivers like growth rates, EBITDA %, and CAPEX assumptions.
- Quarterly and Annual Statements: A complete breakdown of Outbrain Inc.'s (OB) financials.
- Interactive Dashboard: Visualize valuation results and projections dynamically.
Disclaimer
All information, articles, and product details provided on this website are for general informational and educational purposes only. We do not claim any ownership over, nor do we intend to infringe upon, any trademarks, copyrights, logos, brand names, or other intellectual property mentioned or depicted on this site. Such intellectual property remains the property of its respective owners, and any references here are made solely for identification or informational purposes, without implying any affiliation, endorsement, or partnership.
We make no representations or warranties, express or implied, regarding the accuracy, completeness, or suitability of any content or products presented. Nothing on this website should be construed as legal, tax, investment, financial, medical, or other professional advice. In addition, no part of this site—including articles or product references—constitutes a solicitation, recommendation, endorsement, advertisement, or offer to buy or sell any securities, franchises, or other financial instruments, particularly in jurisdictions where such activity would be unlawful.
All content is of a general nature and may not address the specific circumstances of any individual or entity. It is not a substitute for professional advice or services. Any actions you take based on the information provided here are strictly at your own risk. You accept full responsibility for any decisions or outcomes arising from your use of this website and agree to release us from any liability in connection with your use of, or reliance upon, the content or products found herein.