|
PharmaCyte Biotech, Inc. (PMCB): SWOT Analysis [Nov-2025 Updated] |
Fully Editable: Tailor To Your Needs In Excel Or Sheets
Professional Design: Trusted, Industry-Standard Templates
Investor-Approved Valuation Models
MAC/PC Compatible, Fully Unlocked
No Expertise Is Needed; Easy To Follow
PharmaCyte Biotech, Inc. (PMCB) Bundle
When you look at PharmaCyte Biotech (PMCB), you see a company sitting on over $45.5 million in cash and a proprietary drug delivery system, but with $0 million in revenue and a four-year-long FDA clinical hold on its lead product, CypCaps™. This is the ultimate biotech high-stakes gamble: a balance sheet strong enough to acquire new assets, but a core technology stuck in regulatory limbo. We need to map out the strengths that provide this cushion and the threats that could erode it, because the next few quarters will defintely decide which way this stock moves.
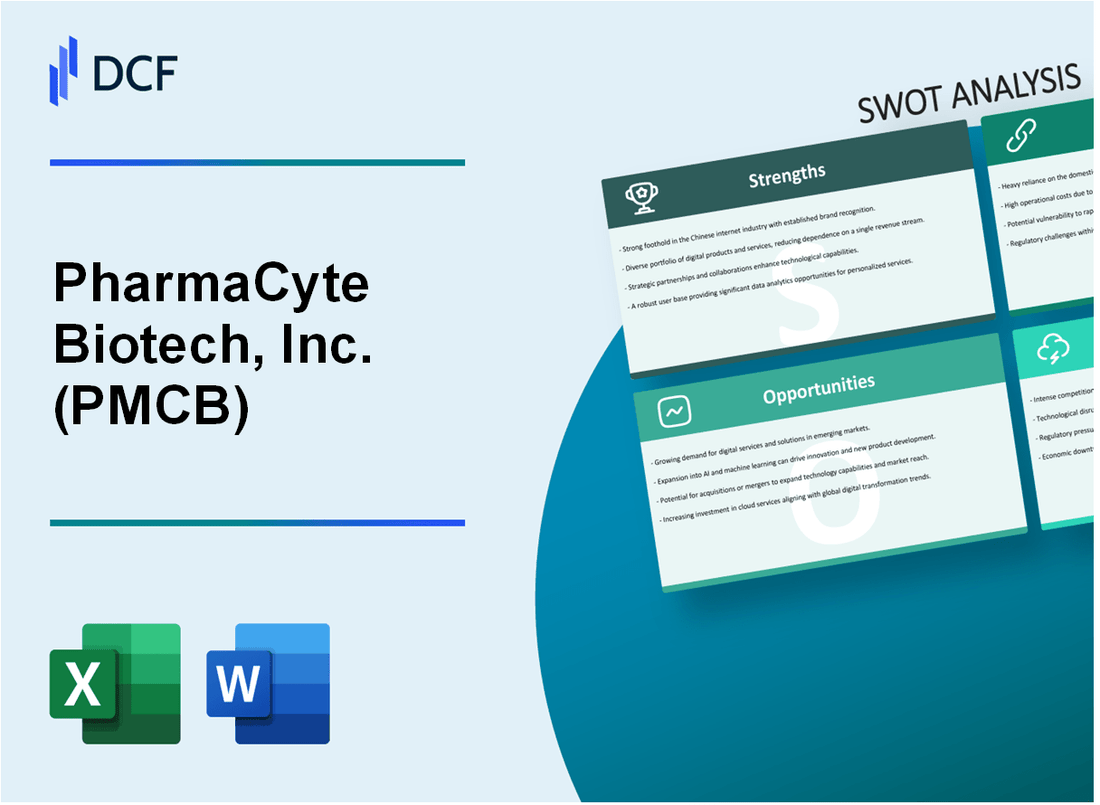
PharmaCyte Biotech, Inc. (PMCB) - SWOT Analysis: Strengths
You are looking at a clinical-stage biotech company, PharmaCyte Biotech, Inc., that is sitting on a significant financial cushion and a genuinely unique technology platform. The core strength here isn't just the science, but the financial runway it provides, which is defintely critical for a company facing a clinical hold.
The company's most compelling strengths center on its proprietary drug-delivery system and a clean balance sheet that gives it substantial strategic flexibility in the near term, especially for a firm in the pre-revenue stage.
Proprietary Cell-in-a-Box® technology for targeted drug delivery.
PharmaCyte Biotech's most significant asset is its patented Cell-in-a-Box® technology, a cellulose-based live cell encapsulation system. This isn't a traditional drug; it's a bio-artificial organ designed to activate a chemotherapy prodrug (inactive drug) right at the tumor site. This targeted approach is a major differentiator in the pancreatic cancer space.
The technology works by encapsulating genetically modified live cells-about 10,000 per capsule-which are implanted near the tumor. When the inactive chemotherapy drug, ifosfamide, is administered intravenously at a much lower dose (often one-third the normal dose), the encapsulated cells act as a 'bio-artificial liver,' converting the drug into its active, cancer-killing form locally. [cite: 1, 2, 10 in first search]
- Creates a localized drug-activation site near the cancer.
- Uses a lower, safer dose of the chemotherapy prodrug.
- Has potential applications beyond cancer, including Type 1 and Type 2 diabetes. [cite: 1, 2 in first search]
Potential for reduced systemic toxicity in chemotherapy delivery.
The ability to activate the chemotherapy drug, ifosfamide, directly at the tumor site is a huge clinical advantage. This targeted activation minimizes the drug's exposure to the rest of the body, which is what causes the severe, systemic side effects (toxicity) typically associated with chemotherapy. Early clinical trials have supported this, showing a strong anti-tumor effect with little-to-no treatment-related side effects. [cite: 1, 2 in first search]
This is a game-changer for patient quality of life. By using a one-third dose and localizing the activation, you get a concentrated, potent cancer-killing effect exactly where you need it, but you bypass much of the damage to healthy tissues. That's a powerful value proposition for patients and oncologists alike. [cite: 2 in first search]
Strong financial health with a 7.7x current ratio (current assets vs. liabilities).
Financial health is a major strength, especially for a biotech company in the development stage. As of the fiscal year ended April 30, 2025, PharmaCyte Biotech had a current ratio of approximately 7.7x. [cite: 6 in second search, 11 in first search] This is calculated by dividing total current assets by total current liabilities, and a ratio this high signals exceptional liquidity. Put simply, the company has $7.70 in short-term assets for every $1.00 of short-term debt it owes. For a more recent look, the current ratio was even higher at 18.01x as of July 31, 2025. [cite: 1 in second search]
Here's the quick math on the most recent quarter (Q1 2026, ended July 31, 2025):
| Financial Metric | Amount (USD) as of July 31, 2025 |
|---|---|
| Total Current Assets | $19,106,338 |
| Total Current Liabilities | $1,060,865 |
| Current Ratio | 18.01x |
Substantially reduced operational burn rate and low operating expenses of $4.38 million in FY 2025.
The company has done a solid job of controlling its spending, which extends its financial runway. Operating expenses for the fiscal year ended April 30, 2025, totaled only $4.38 million. [cite: 4 in first search] This represents a significant year-over-year decrease, largely due to reductions in compensation, director fees, and legal/professional expenses. [cite: 4 in first search] This low burn rate means the existing cash can fund operations for a much longer period, buying the company time to resolve its clinical hold issues with the FDA and pursue new strategic opportunities.
Significant cash and investments, totaling over $45.5 million as of August 2025.
PharmaCyte Biotech holds a substantial war chest of cash and investments. As of April 30, 2025, the company reported holding approximately $15.5 million in cash and over $30 million in securities, totaling over $45.5 million in liquid assets. [cite: 6 in second search] This figure was further bolstered by a $7 million financing round that closed in August 2025. [cite: 6, 8 in second search] This capital gives the management team immense optionality.
This cash position allows the company to:
- Fund R&D for the planned locally advanced pancreatic cancer (LAPC) trial. [cite: 4 in first search]
- Address the FDA's clinical hold requirements without immediate pressure.
- Pursue strategic acquisitions or partnerships to create new shareholder value. [cite: 3 in first search, 6 in second search]
PharmaCyte Biotech, Inc. (PMCB) - SWOT Analysis: Weaknesses
You're looking at PharmaCyte Biotech, Inc. (PMCB) and seeing a biotech with a massive hurdle: a lack of internal operational scale and a stalled lead product. The company's financial results for the 2025 fiscal year, while showing a paper profit, reveal a core weakness in its business model-it simply isn't generating revenue from its core mission.
The biggest risk here is that the entire enterprise hinges on a single, delayed product and an extremely lean operating structure. It's defintely a high-risk, high-reward profile, but the risks are near-term and concrete.
Zero Revenue ($0 million) Reported for the Fiscal Year Ended April 30, 2025
The most immediate weakness is the complete absence of commercial activity. For the fiscal year ended April 30, 2025, PharmaCyte Biotech reported $0 million in revenue. This is a critical point for a clinical-stage company, as it means all operations are funded by capital raises and non-operational gains, not by sales or licensing of its core technology, Cell-in-a-Box®.
The company is essentially a cash-burning entity focused on R&D, which is fine for a biotech, but the lack of a clear revenue path for the foreseeable future puts sustained pressure on the balance sheet and future dilution risk. Here's the quick math on the operational side:
- Revenue (FY 2025): $0 million
- Operating Expenses (FY 2025): $4.38 million
- Net Operating Loss (FY 2025): $4.38 million (before non-operational items)
Lead Product, CypCaps™, is on an FDA Clinical Hold Since 2020, Stalling Trials
The core value driver, the CypCaps™ product candidate for locally advanced pancreatic cancer (LAPC), remains on a U.S. Food and Drug Administration (FDA) clinical hold. This hold was initiated in October 2020 after the submission of the Investigational New Drug application (IND). The FDA requested additional preclinical studies, manufacturing information, and product release specifications.
This four-year delay is a major headwind. It stalls the planned Phase 2b clinical trial, pushing back any potential commercialization timeline by years and increasing the cost of development. Until the FDA's non-clinical issues are resolved and the hold is lifted, the company cannot move forward with human trials for its lead indication.
High Dependence on a Single, Licensed Core Technology and its Know-How Provider, SG Austria
PharmaCyte Biotech is highly dependent on a single, proprietary technology, Cell-in-a-Box®, which is licensed from SG Austria Pte. Ltd. (and its subsidiary, Austrianova). The success of PharmaCyte Biotech is co-dependent with the success of SG Austria and Austrianova, creating a single point of failure for the entire pipeline.
This reliance is a significant operational and strategic weakness. Any dispute, financial instability, or technical issue at SG Austria or Austrianova could jeopardize PharmaCyte Biotech's entire development program. In fact, the company has previously had to reevaluate whether to continue programs dependent on SG Austria due to alignment concerns, which has also delayed addressing the FDA clinical hold.
Net Income of $30.66 million in FY 2025 Was Driven by Non-Operational Financial Gains
While the company reported a net income of $30.66 million for the fiscal year ended April 30, 2025, this figure is misleading from an operational perspective. This profit was not generated from selling a product or service. Instead, it was primarily driven by non-operational financial gains, such as changes in the fair value of investments and warrant liabilities.
This type of income is volatile and non-recurring. It doesn't reflect the underlying health of the biotechnology business, which is still losing money from its core R&D activities. Investors need to look past the headline net income number to the operating loss.
| Financial Metric (FY Ended 04/30/2025) | Amount (USD) | Nature of Income/Loss |
|---|---|---|
| Revenue | $0 million | None |
| Operating Expenses | $4.38 million | Operational burn rate |
| Net Income | $30.66 million | Primarily non-operational financial gains |
Very Small Internal Team, Relying Heavily on Consultants for R&D and Regulatory Work
PharmaCyte Biotech operates with an extremely small internal team, relying almost entirely on external experts for its critical functions. As of April 30, 2025, the company had only 2 employees. This is a biotech company with two employees.
This reliance on external parties extends to the most crucial aspects of the business: all research and development (R&D) work is handled by consultants, and a team of scientific and regulatory consultants is managing the response to the FDA clinical hold. While consultants provide specialized expertise, this structure creates a significant risk:
- Lack of Institutional Knowledge: Core know-how resides outside the company.
- Coordination Risk: Managing a complex, multi-faceted IND submission with entirely external teams increases the risk of miscommunication or delays.
- Cost Inefficiency: High-level consulting fees can be less cost-effective than a dedicated, in-house team over the long term.
The small internal team means the company lacks the infrastructure for a smooth transition to clinical trials or, eventually, commercialization. They are entirely dependent on third-party contractor performance.
PharmaCyte Biotech, Inc. (PMCB) - SWOT Analysis: Opportunities
Vast unmet medical need in locally advanced, non-resectable pancreatic cancer (LAPC)
The core opportunity for PharmaCyte Biotech lies in addressing the critical gap in treatment for locally advanced, non-resectable pancreatic cancer (LAPC). The company's Cell-in-a-Box technology, combined with low-dose ifosfamide, is specifically targeting patients whose tumors no longer respond to the current standard of care, which is typically the combination of nab-paclitaxel (Abraxane) plus gemcitabine.
This is a high-value, high-need segment. The global pancreatic cancer precision medicine market, where PharmaCyte is a key entity, was estimated at $656.8 million in 2024 and is projected to reach $1.88 billion by 2030. That's a compound annual growth rate (CAGR) of 19.2% from 2025 to 2030. Honestly, filling this void with an effective consolidation therapy would be a game-changer for patient survival and a massive commercial win.
Broad platform potential to expand into diabetes (artificial pancreas) and malignant ascites
The Cell-in-a-Box live-cell encapsulation technology is not a one-trick pony; it's a platform, and that's a huge opportunity. The company is actively pursuing two other major indications: diabetes and malignant ascites.
For diabetes, the goal is to create a 'bio-artificial pancreas' by encapsulating a genetically engineered human cell line that can produce and release insulin in response to blood sugar levels. Plus, the malignant ascites program, which uses the same encapsulated cells as the pancreatic cancer therapy, addresses a condition where currently, there is no available therapy to prevent or delay the fluid's production and accumulation. They've already seen positive interim results in a mouse model study for malignant ascites.
| Platform Expansion Target | Mechanism of Action | Market Need/Status |
|---|---|---|
| Type 1 & 2 Diabetes | Encapsulated cells act as a 'bio-artificial pancreas' to produce insulin. | Addresses insulin-dependent patients; potential for a functional cure. |
| Malignant Ascites | Uses the same CypCaps cells as LAPC therapy, placed in the peritoneal cavity. | No current therapy exists to prevent or delay fluid accumulation; palliative care is the norm. |
Leveraging the strong cash position for strategic acquisitions and accretive investments
You have a solid financial foundation to work from, which is defintely a strength in the biotech space. As of April 30, 2025, PharmaCyte Biotech had approximately $15.5 million in cash and held over $30 million in securities. Here's the quick math: with the additional $7 million financing closed on August 20, 2025, the company has roughly $52.5 million in liquid assets and investments.
This capital gives management significant financial flexibility. They can use this war chest for strategic, accretive investments-meaning acquisitions or partnerships that immediately add value, technology, or a new pipeline asset, not just burning cash on existing programs. That's how you build a diversified, sustainable biotech.
Potential for partnership discussions if the FDA hold issues are defintely resolved
The single biggest catalyst for partnership discussions is the resolution of the U.S. Food and Drug Administration (FDA) clinical hold on the Investigational New Drug (IND) application for the LAPC treatment. The hold, which was placed in October 2020, requires the company to complete several preclinical studies and provide additional data, including a large animal (pig) study.
If PharmaCyte successfully addresses all the FDA's requests and the hold is lifted, the value proposition immediately skyrockets. An open IND would signal regulatory confidence and drastically de-risk the program for a major pharmaceutical partner. This would open the door to lucrative licensing or co-development deals, bringing in non-dilutive capital and leveraging a partner's global commercialization and clinical trial expertise. The opportunity is enormous, but it hinges entirely on that regulatory clearance.
Recent shareholder approval to issue up to 2,250,000 more shares for the equity incentive plan
On October 30, 2025, stockholders approved an amendment to the 2022 Equity Incentive Plan to increase the number of shares available for awards by 2,250,000 shares. This is an operational opportunity, not a financial one, but it's crucial.
This approval is a clear signal that the company is serious about attracting and retaining top-tier talent-the engineers, scientists, and regulatory experts needed to finally lift that FDA hold and advance the pipeline. The vote passed with strong support: 2,348,827 for versus 399,696 against. You can't execute a complex biotech strategy without the right people, so having a robust equity pool is a necessary tool for growth and execution.
PharmaCyte Biotech, Inc. (PMCB) - SWOT Analysis: Threats
You're looking at PharmaCyte Biotech, Inc.'s (PMCB) threats, and honestly, they boil down to a handful of high-stakes, binary events. The biggest risks are regulatory clearance-or the lack thereof-and the constant pressure of a low market capitalization in a capital-intensive industry. You need to map these near-term threats to the company's ability to fund its operations and move its lead candidate forward. The oncology cell encapsulation market is unforgiving.
Risk of failing to satisfy the FDA's specific guidance to lift the clinical hold.
The core threat to PharmaCyte Biotech is the ongoing clinical hold placed by the U.S. Food and Drug Administration (FDA) on its Investigational New Drug Application (IND) for the locally advanced, inoperable pancreatic cancer (LAPC) treatment. This hold, initiated in October 2020, is a multi-year roadblock. To lift it, the FDA required the company to complete a lengthy list of items, including several additional preclinical studies, more manufacturing data, and specific product release specifications.
The company has been working to address these points, for instance, by completing an 18-month stability timepoint for its product and producing a Master Cell Bank. Still, as of late 2025, a complete response submission to the FDA is pending. This means the company's lead program remains stalled, burning cash for studies instead of advancing to a Phase 2b clinical trial. The longer the hold, the greater the risk that the technology becomes obsolete or the company runs out of capital to satisfy the requirements. It's a classic biotech bottleneck.
Intense competition from larger, well-funded biopharma companies in oncology.
PharmaCyte Biotech operates in the live cell encapsulation market, which is projected to reach a value of $2.28 billion in 2025. This is a high-growth, high-competition space where much larger players are making significant moves. Your competition isn't just other pancreatic cancer treatments; it's other advanced cell encapsulation platforms backed by Big Pharma money.
For example, Eli Lilly acquired Sigilon Therapeutics, accelerating its development of immune-evasive cell encapsulation therapies. Other major players focusing on advanced cell therapies and encapsulation technologies include Bristol Myers Squibb, Medtronic, and Merck KGaA. These companies have the financial resources, regulatory expertise, and established manufacturing infrastructure that PharmaCyte Biotech, with its micro-cap status, simply cannot match. They can absorb a clinical setback; PharmaCyte Biotech cannot. This is a battle of capital and scale.
The competitive landscape is defined by deep pockets and diverse pipelines:
- Eli Lilly: Accelerating immune-evasive cell encapsulation development.
- Bristol Myers Squibb: Major player in the broader cell therapy market.
- Merck KGaA: Provides capabilities in encapsulation technologies, often through partnerships.
- Medtronic: Active in the cell encapsulation technology market.
Dilution risk from authorized share issuance exceeding 20% of outstanding common stock.
The company's need for capital, especially while the IND is on clinical hold, creates a significant and immediate dilution threat for current shareholders. In October 2025, stockholders approved the issuance of shares of common stock underlying convertible preferred stock and warrants in an amount equal to or in excess of 20% of the common shares outstanding.
Here's the quick math on the August 2025 financing: this transaction authorized the potential issuance of up to 7,000,000 shares from the conversion of Series C preferred stock and up to an additional 7,000,000 shares from warrants. Considering the company had approximately 21,672,095 shares outstanding as of July 31, 2025, the potential 14,000,000 new shares represent a dilution of about 64.6%. This is a massive dilution event that severely impacts the value of existing holdings, a painful necessity for a company without revenue.
Reliance on the sole licensor for the Cell-in-a-Box® technology know-how.
PharmaCyte Biotech's entire platform is built on the Cell-in-a-Box® technology, which is exclusively licensed from SG Austria Pte. Ltd. and its subsidiary, Austrianova Singapore Pte. Ltd.. This reliance creates a single point of failure for the company's core intellectual property (IP) and technical know-how.
The license is royalty-bearing, and Austrianova is also a partner for manufacturing the clinical trial material. The risk is that any material change, dispute, or financial instability at the licensor could halt PharmaCyte Biotech's development overnight. While the company has an exclusive, worldwide license, and even a right of first refusal to purchase the IP, technology, and trade secrets for a five-year period (from 2017), the day-to-day reliance on the licensor's technical expertise and continued support for a complex, proprietary process is a constant operational and legal threat.
The stock's low market capitalization of $6.38 million as of late 2025.
The company's low market capitalization of $6.38 million as of late 2025 classifies it as a micro-cap stock. This low valuation is a threat in itself, as it creates a vicious cycle of limited institutional interest, high stock price volatility, and extreme difficulty in raising capital without resorting to severely dilutive financing methods like the one approved in October 2025. A market cap this small signals to the market that the company's pipeline value is highly uncertain, especially given the multi-year clinical hold.
This micro-cap status makes the stock vulnerable to market swings and makes it defintely harder to attract the large, stable institutional investors needed to fund a long, expensive Phase 3 trial, should the IND ever be lifted. It also increases the risk of delisting if the share price cannot maintain compliance with exchange rules.
| Metric | Value (As of Late 2025) | Threat Implication |
|---|---|---|
| Market Capitalization | $6.38 million | Signifies micro-cap status, leading to high volatility and limited access to non-dilutive capital. |
| Potential Dilution (Aug '25 Financing) | Up to 14,000,000 shares | Represents a potential dilution of approximately 64.6% of outstanding shares (based on July 2025 shares). |
| Live Cell Encapsulation Market Value | $2.28 billion in 2025 | Large market attracts well-funded, major biopharma competitors (e.g., Eli Lilly, Merck KGaA). |
| FDA Clinical Hold Status | Pending a complete response to a lengthy list of preclinical, data, and manufacturing requirements | Stalls the lead LAPC program, burning cash and increasing the risk of obsolescence. |
Disclaimer
All information, articles, and product details provided on this website are for general informational and educational purposes only. We do not claim any ownership over, nor do we intend to infringe upon, any trademarks, copyrights, logos, brand names, or other intellectual property mentioned or depicted on this site. Such intellectual property remains the property of its respective owners, and any references here are made solely for identification or informational purposes, without implying any affiliation, endorsement, or partnership.
We make no representations or warranties, express or implied, regarding the accuracy, completeness, or suitability of any content or products presented. Nothing on this website should be construed as legal, tax, investment, financial, medical, or other professional advice. In addition, no part of this site—including articles or product references—constitutes a solicitation, recommendation, endorsement, advertisement, or offer to buy or sell any securities, franchises, or other financial instruments, particularly in jurisdictions where such activity would be unlawful.
All content is of a general nature and may not address the specific circumstances of any individual or entity. It is not a substitute for professional advice or services. Any actions you take based on the information provided here are strictly at your own risk. You accept full responsibility for any decisions or outcomes arising from your use of this website and agree to release us from any liability in connection with your use of, or reliance upon, the content or products found herein.