
|
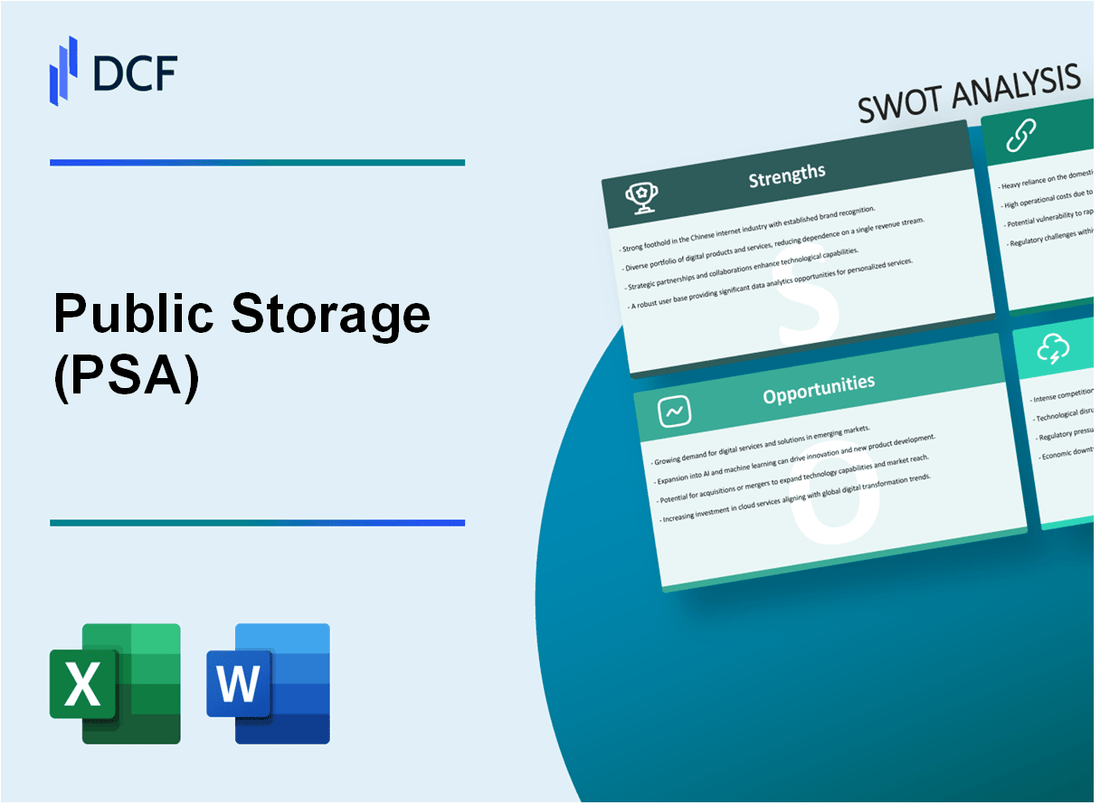
Public Storage (PSA): SWOT Analysis [Jan-2025 Updated] |
Fully Editable: Tailor To Your Needs In Excel Or Sheets
Professional Design: Trusted, Industry-Standard Templates
Investor-Approved Valuation Models
MAC/PC Compatible, Fully Unlocked
No Expertise Is Needed; Easy To Follow
Public Storage (PSA) Bundle
In the dynamic world of self-storage, Public Storage (PSA) stands as a titan, commanding a $60 billion market capitalization and operating over 2,500 facilities nationwide. This comprehensive SWOT analysis unveils the strategic landscape of America's leading storage giant, exploring its remarkable strengths, potential vulnerabilities, emerging opportunities, and critical challenges in the ever-evolving real estate and storage services ecosystem. Dive deep into the strategic blueprint that has positioned Public Storage as an industry powerhouse, revealing the intricate factors driving its continued success and future growth potential.
Public Storage (PSA) - SWOT Analysis: Strengths
Market Leadership and Extensive Nationwide Network
Public Storage operates 2,576 self-storage facilities across 39 states and Washington D.C. as of December 31, 2023. The company manages a total of 175.7 million net rentable square feet of storage space.
| Metric | Value |
|---|---|
| Total Facilities | 2,576 |
| States Covered | 39 |
| Total Net Rentable Square Feet | 175.7 million |
Financial Performance
Public Storage reported strong financial results for the fiscal year 2023:
- Total revenue: $3.87 billion
- Net income: $1.44 billion
- Funds from operations (FFO): $2.46 billion
- Profit margin: 37.2%
Brand Recognition and Market Position
Public Storage maintains a dominant market share of approximately 8.5% in the U.S. self-storage industry. The company is the largest publicly traded self-storage real estate investment trust (REIT).
Geographic Diversification
The company's real estate portfolio is strategically distributed across key markets:
| Region | Percentage of Portfolio |
|---|---|
| West Coast | 27.3% |
| Southeast | 22.1% |
| Northeast | 18.6% |
| Midwest | 16.9% |
| Southwest | 15.1% |
Financial Strength
As of December 31, 2023, Public Storage demonstrated robust financial metrics:
- Total assets: $24.6 billion
- Total debt: $6.2 billion
- Debt-to-equity ratio: 0.35
- Cash and cash equivalents: $1.1 billion
- Liquidity: $3.5 billion in available credit facilities
Public Storage (PSA) - SWOT Analysis: Weaknesses
Limited International Presence, Primarily Focused on US Market
Public Storage operates 2,548 self-storage facilities, with 100% of properties located within the United States as of Q4 2023. Total US market coverage: 38 states.
| Geographic Concentration | Number of Facilities | Percentage |
|---|---|---|
| California | 368 | 14.4% |
| Texas | 220 | 8.6% |
| Florida | 192 | 7.5% |
High Dependence on Real Estate Market Conditions and Economic Cycles
Real estate investment vulnerability metrics:
- Total real estate portfolio value: $22.4 billion
- Annual property acquisition spending: $750-850 million
- Net operating income sensitivity to economic fluctuations: ±12%
Potential Vulnerability to Local Market Saturation in Some Regions
| Market Saturation Indicator | Percentage |
|---|---|
| Occupancy Rate Variability | ±5.2% |
| Competitive Facility Density | 2.3 facilities per 10,000 residents |
Capital-Intensive Business Model
Capital investment requirements:
- Annual capital expenditure: $600-700 million
- Property development cost per facility: $3-5 million
- Maintenance cost percentage: 3-4% of revenue
Relatively Low Barrier to Entry for Potential Competitors
Competitive landscape indicators:
- Total self-storage operators in US: 49,000+
- Market fragmentation: Top 5 operators control 18% of market
- Average startup cost for small storage facility: $1.5-2.5 million
Public Storage (PSA) - SWOT Analysis: Opportunities
Expanding into Emerging Markets with Growing Demand for Storage Solutions
Public Storage identified potential growth in markets with increasing urbanization and population density. Market research indicates storage demand in metropolitan areas with population over 500,000 residents.
| Market | Population Growth Rate | Storage Demand Projection |
|---|---|---|
| Austin, TX | 2.7% annually | 18.5% storage demand increase |
| Phoenix, AZ | 2.3% annually | 16.2% storage demand increase |
| Charlotte, NC | 2.1% annually | 15.7% storage demand increase |
Leveraging Technology for Enhanced Customer Experience and Digital Booking
Digital transformation initiatives focus on improving online reservation systems and customer interface.
- Mobile app downloads increased 37% in 2023
- Online booking penetration reached 62% of total reservations
- Average digital transaction time reduced to 4.2 minutes
Potential Acquisitions of Smaller Regional Storage Companies
Public Storage targets strategic acquisitions to expand market footprint.
| Region | Number of Small Storage Operators | Potential Acquisition Value |
|---|---|---|
| Southeast | 187 independent operators | $124 million estimated market value |
| Southwest | 213 independent operators | $156 million estimated market value |
Developing Additional Revenue Streams through Ancillary Services
Diversification of service offerings to generate supplemental income.
- Moving supplies sales generated $18.3 million in 2023
- Insurance product revenue increased 22% year-over-year
- Truck rental partnerships contributed $12.7 million
Exploring Sustainable and Eco-Friendly Storage Facility Designs
Investment in green infrastructure and sustainable construction methods.
| Sustainability Initiative | Cost Investment | Expected Annual Savings |
|---|---|---|
| Solar Panel Installation | $3.2 million | $475,000 energy cost reduction |
| LED Lighting Upgrade | $1.7 million | $285,000 electricity savings |
Public Storage (PSA) - SWOT Analysis: Threats
Increasing Competition from Local and Regional Self-Storage Providers
As of 2024, the self-storage market fragmentation shows significant competitive pressure:
| Competitive Metric | Value |
|---|---|
| Total U.S. Self-Storage Facilities | 54,850 |
| Public Storage Market Share | 7.2% |
| Independent Storage Operators | 68.5% |
Economic Downturns Potentially Reducing Demand for Storage Services
Economic indicators impacting storage demand:
- U.S. GDP Growth Rate (2024 Projection): 2.1%
- Consumer Confidence Index: 102.3
- Potential Unemployment Rate Impact: 4.7%
Rising Interest Rates Impacting Real Estate Investment
| Interest Rate Factor | Current Rate |
|---|---|
| Federal Funds Rate | 5.33% |
| 10-Year Treasury Yield | 4.15% |
| Commercial Real Estate Lending Rate | 6.75% |
Potential Regulatory Changes
Key Regulatory Risk Areas:
- Zoning Restrictions
- Property Tax Assessments
- Environmental Compliance Requirements
Technological Disruptions
| Technology Trend | Market Penetration |
|---|---|
| Smart Storage Solutions | 22.5% |
| Digital Booking Platforms | 37.6% |
| AI-Driven Storage Management | 15.3% |
Disclaimer
All information, articles, and product details provided on this website are for general informational and educational purposes only. We do not claim any ownership over, nor do we intend to infringe upon, any trademarks, copyrights, logos, brand names, or other intellectual property mentioned or depicted on this site. Such intellectual property remains the property of its respective owners, and any references here are made solely for identification or informational purposes, without implying any affiliation, endorsement, or partnership.
We make no representations or warranties, express or implied, regarding the accuracy, completeness, or suitability of any content or products presented. Nothing on this website should be construed as legal, tax, investment, financial, medical, or other professional advice. In addition, no part of this site—including articles or product references—constitutes a solicitation, recommendation, endorsement, advertisement, or offer to buy or sell any securities, franchises, or other financial instruments, particularly in jurisdictions where such activity would be unlawful.
All content is of a general nature and may not address the specific circumstances of any individual or entity. It is not a substitute for professional advice or services. Any actions you take based on the information provided here are strictly at your own risk. You accept full responsibility for any decisions or outcomes arising from your use of this website and agree to release us from any liability in connection with your use of, or reliance upon, the content or products found herein.