
|
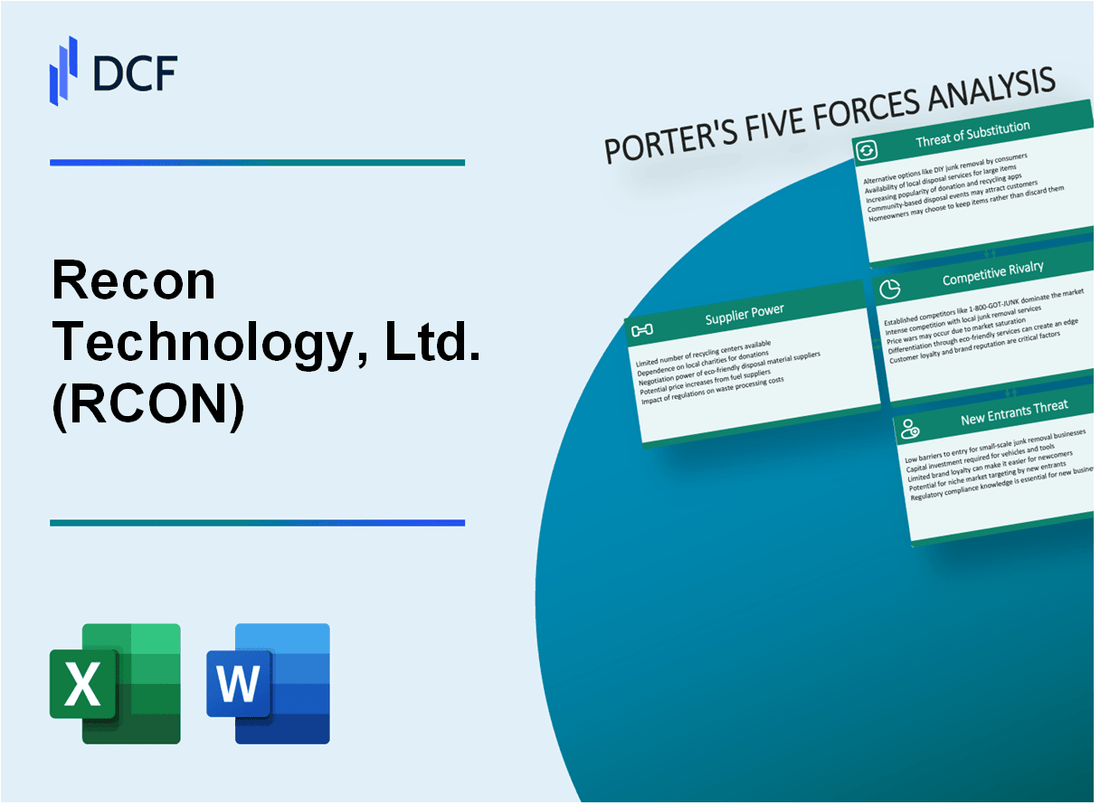
Recon Technology, Ltd. (RCON): 5 FORCES Analysis [Nov-2025 Updated] |
Fully Editable: Tailor To Your Needs In Excel Or Sheets
Professional Design: Trusted, Industry-Standard Templates
Investor-Approved Valuation Models
MAC/PC Compatible, Fully Unlocked
No Expertise Is Needed; Easy To Follow
Recon Technology, Ltd. (RCON) Bundle
You're looking at a company, Recon Technology, Ltd., caught in a real bind, and honestly, the numbers from fiscal year 2025 tell a tough story. We see major headwinds across the board, especially with state-owned oil giants acting as massive customers who are squeezing prices, which is clearly why the gross margin took a sharp dive to 23.0% from 30.3%-that's intense rivalry at work. Plus, with revenue shrinking by 3.7% and the company posting a net loss of RMB 44.2 million, you need to know exactly where the pressure points are, from supplier costs jumping 20.0% to the difficulty of new players getting in. To really map out the near-term risks and see if this business can navigate this environment, you need a clear breakdown of Porter's Five Forces, so let's dive into the specifics below.
Recon Technology, Ltd. (RCON) - Porter's Five Forces: Bargaining power of suppliers
You're looking at Recon Technology, Ltd.'s (RCON) supplier dynamics for late 2025, and honestly, the numbers suggest suppliers are holding some cards. The most concrete evidence we have is the pressure on Recon Technology's cost base, particularly in its core automation segment. For the fiscal year ended June 30, 2025, the cost of revenue specifically for automation products and software jumped by a significant 20.0%, rising from approximately RMB 23.9 million in FY2024 to RMB 28.6 million in FY2025. That's a substantial increase in input costs, especially when total revenue for RCON only dipped by 3.7% to RMB 66.3 million in the same period.
Here's a quick look at how that cost pressure hit the bottom line:
| Metric | FY2025 (RMB Million) | FY2024 (RMB Million) | Change (%) |
|---|---|---|---|
| Total Revenue | 66.3 | 68.8 | -3.7% |
| Cost of Revenue - Automation Products | 28.6 | 23.9 | +20.0% |
| Gross Margin | 23.0% | 30.3% | -24.2% |
This disparity-a 20.0% rise in a key cost component against a small overall revenue decline-is what signals supplier leverage. Recon Technology's overall scale, with total revenue at just RMB 66.3 million for FY2025, definitely limits its negotiation muscle. When you're dealing with specialized, high-tech components for industrial automation, being a relatively small buyer means you take the price the supplier offers; you can't easily demand better terms.
The nature of Recon Technology's business compounds this issue. The company is an independent solutions integrator providing advanced automated technologies and industrial automation control systems. This focus means they rely on a specific set of vendors for proprietary hardware or software modules. If Recon Technology integrates a specific high-tech component into its automation systems, ripping it out and replacing it with a competitor's product isn't a simple swap. That creates high switching costs, not just in terms of finding a new part, but in re-engineering the entire integrated solution, which is a major operational headache.
To be fair, for niche technology providers, the supplier base can be thin. Recon Technology's reliance on specialized suppliers for its automation systems means that for certain critical, proprietary parts, those suppliers effectively operate with quasi-monopolistic power. This power is amplified because Recon Technology's customers-major oil exploration companies like Sinopec and CNPC-demand reliable, high-performance systems, meaning Recon Technology cannot risk using unproven or non-standard components just to save a few RMB on procurement.
The supplier power is further evidenced by the margin compression we saw:
- Cost of revenue for automation products increased 20.0% in FY2025.
- Total revenue for FY2025 was only RMB 66.3 million.
- Gross margin fell to 23.0% from 30.3% year-over-year.
- The need to maintain system integrity implies high costs to switch core components.
Finance: draft a sensitivity analysis on a 10% sustained increase in automation component COGS by next Tuesday.
Recon Technology, Ltd. (RCON) - Porter's Five Forces: Bargaining power of customers
The bargaining power of customers for Recon Technology, Ltd. is demonstrably high, stemming from the concentrated nature of its core client base and the prevailing economic environment in late 2025.
- Primary customers are China's domestic oil companies, giving them massive purchase power.
- Customers are 'cost-conscious' and cutting capital expenditures due to oil price volatility.
- Revenue decreased by 3.7% in FY2025, reflecting customers' ability to demand lower prices or reduce orders.
- Customers can choose alternative domestic or international oilfield service providers easily, evidenced by Recon Technology, Ltd.'s diversification efforts.
You see this power play out directly in the financial results for the fiscal year ended June 30, 2025. Total revenues for Recon Technology, Ltd. settled at approximately RMB 66.3 million ($9.3 million), a drop of about 3.7% from the prior year's RMB 68.8 million ($9.6 million). This top-line contraction is a clear signal that the buyers held the upper hand in price negotiations or order volume decisions.
Honestly, the CEO confirmed this dynamic, noting that during the 2025 financial year, the primary clients, the domestic oil companies, experienced declining performance due to oil price fluctuations. Consequently, they adopted more cautious and cost-conscious approaches to capital expenditures and expense management. This cost control directly translated into reduced spending on Recon Technology, Ltd.'s services and products, which negatively impacted the Company's profitability.
The impact of this buyer power was not uniform across all segments, showing where customers exerted the most pressure:
| Revenue Segment (FY2025 vs FY2024) | Change Amount (RMB) | Change Amount (USD) | Percentage Change |
|---|---|---|---|
| Total Revenue | (RMB 2.5 million) | ($0.4 million) | -3.7% |
| Equipment and Accessories | (RMB 2.0 million) | ($0.3 million) | -10.0% |
| Oilfield Environmental Protection | (RMB 7.3 million) | ($1.0 million) | -41.4% |
The 41.4% plunge in oilfield environmental protection revenue is particularly telling, suggesting severe price concessions or project deferrals in that area. To be fair, the CEO mentioned securing new clients outside the oilfield industry and expanding with offshore customers, which helped stabilize operations. This diversification is a direct strategic action to mitigate reliance on the powerful domestic onshore buyers.
The ability for customers to switch providers is implicitly high. If the primary domestic customers had high switching costs, they would be less likely to enforce such strict cost controls that resulted in a 3.7% revenue decline for Recon Technology, Ltd.. The fact that Recon Technology, Ltd. is actively seeking and securing business with offshore oilfield customers and non-oilfield clients suggests that the existing customer base has viable alternatives or the leverage to force pricing terms that led to the revenue contraction.
Finance: draft sensitivity analysis on RMB 66.3 million FY2025 revenue based on a 10% price cut from domestic clients by next Tuesday.
Recon Technology, Ltd. (RCON) - Porter's Five Forces: Competitive rivalry
You're looking at Recon Technology, Ltd. (RCON) in a market where the big players have government backing. That immediately changes the game, honestly. Recon Technology competes directly with larger, often state-backed, oilfield service companies in what is definitely a mature market. This environment means that survival often comes down to who can absorb the tightest pricing, and that pressure shows up right in the financials.
The most concrete evidence of this intense rivalry is the hit to profitability. For the fiscal year ended June 30, 2025, Recon Technology's gross margin took a sharp dive. It fell from 30.3% in the prior year to just 23.0% for FY2025. Here's the quick math on that erosion:
| Metric | FY2024 Value | FY2025 Value | Change (Percentage Points) |
| Gross Margin | 30.3% | 23.0% | -7.3 |
| Gross Profit (RMB millions) | RMB 20.9 million | RMB 15.2 million | -27.0% |
This sharp drop in gross margin to 23.0% in FY2025 is a clear sign of aggressive price competition, as you can see from the RMB 5.7 million decrease in gross profit year-over-year. When margins compress that fast, it tells you competitors are fighting tooth and nail for every contract, likely by undercutting on price to secure volume.
The broader industry context isn't helping matters, either. The oilfield service industry in China is facing slow growth, which naturally intensifies the fight for market share among existing players. For instance, S&P Global Ratings projected China's total oil and gas production growth to be modest, around 3% each year in 2025-2026, while oil demand growth was forecast to be only 2% year-on-year in 2025, which is way down from the average of 5% over the last decade. When the pie isn't growing much, everyone has to fight harder over the existing slices. Still, Recon Technology is trying to offset this by shifting its focus, as evidenced by the gross profit increase in its automation product and software segment, which rose 84.9% in gross profit to RMB 5.5 million in FY2025 from RMB 3.0 million in FY2024.
On the flip side, there are structural factors that keep some players locked in, which can be a double-edged sword. High exit barriers exist in this sector due to the nature of the assets and agreements. These barriers include:
- Specialized, high-cost equipment ownership.
- The presence of long-term service contracts.
- Significant sunk costs in operational infrastructure.
If onboarding takes 14+ days, churn risk rises, but high exit barriers mean customers can't easily switch providers mid-contract, which offers some short-term stability. Finance: draft 13-week cash view by Friday.
Recon Technology, Ltd. (RCON) - Porter's Five Forces: Threat of substitutes
The threat of substitution for Recon Technology, Ltd. (RCON) is multifaceted, stemming from both the core oilfield services business and the long-term energy transition impacting demand for their primary services.
Major oil companies, the primary clients for Recon Technology, Ltd., possess the capital to bring certain services in-house, directly substituting the need for third-party providers like Recon Technology, Ltd. This is particularly relevant in maintenance, where efficiency gains are critical. For instance, corrosion alone costs the oil and gas industry an estimated $1.372 billion annually, and an unexpected onshore facility outage can cost an estimated $7 million a day in lost revenue. The industry's focus on efficiency suggests that bringing high-cost, high-risk maintenance functions internally could be a viable substitution strategy for large operators, though automation is also a counter-trend, with estimates suggesting automation could save the oil and gas industry $73 billion over the next five years using existing technologies.
Substitution risk from alternative energy sources presents a long-term structural headwind. The momentum in renewables is significant; in 2024, renewable energy capacity grew by a remarkable 15.1%, adding 585 GW of new capacity, which accounted for 92.5% of total global capacity expansion. This transition directly pressures the long-term demand for oil and gas extraction services. For example, in the UK, annual gas demand is projected to fall by 40% to 75% between 2024 and 2050 under certain decarbonization pathways.
Customers utilizing Recon Technology, Ltd.'s automation products face a substitution choice between advanced digital solutions and simpler, potentially lower-cost manual or less sophisticated equipment. While Recon Technology, Ltd.'s total revenue for the fiscal year ended June 30, 2025, was RMB 66.3 million ($9.3 million), the decision to adopt or maintain high-tech automation versus simpler methods hinges on the total cost of ownership and operational risk. The Automation Product and Software segment is the majority revenue contributor for Recon Technology, Ltd..
Recon Technology, Ltd.'s strategic response to these substitution threats in its core market involves diversification into the circular economy. The company has invested over $15 million to date in its waste plastic chemical recycling project. This project, expected to be fully operational by November 2025, is designed to produce 30,000 tons of plastic pyrolysis oil and 6,000 tons of carbon residue annually, with estimated annual returns of $30 million. This move diversifies revenue streams away from the direct substitution pressures in the oilfield service sector.
Here is a snapshot of the financial context surrounding Recon Technology, Ltd. and the broader energy shift:
| Metric | Value (FY Ended June 30, 2025) | Context/Comparison |
| Total Revenue | RMB 66.3 million ($9.3 million) | A decrease of 3.7% from RMB 68.8 million ($9.6 million) in FY 2024 |
| Cash on Hand | RMB 98.9 million ($13.8 million) | As of June 30, 2025 |
| Chemical Recycling Investment (to date) | Over $15 million | Investment in the 40,000-ton-per-year project |
| Projected Annual Returns (Recycling) | Estimated $30 million | From 30,000 tons of pyrolysis oil and 6,000 tons of carbon residue |
| Automation Savings Potential (Industry) | Estimated $73 billion | Projected savings over five years using existing technologies in oil and gas |
| Renewable Capacity Growth (2024) | 15.1% | Global capacity addition, signaling substitution trend |
The potential for substitution is also visible across Recon Technology, Ltd.'s own reported segment performance, which reflects the competitive environment:
- Gross profit from Equipment and Accessories decreased by 10.9% for the six months ended December 31, 2024.
- Gross profit from Oilfield Environmental Protection was negative RMB 2.1 million (negative $0.3 million) for the six months ended December 31, 2024.
- Gross profit from Automation Product and Software increased to RMB 8.0 million for the six months ended December 31, 2024.
- The Oilfield Services sector saw its best performance in the past 34 years between 2023 and 2024.
Recon Technology, Ltd. (RCON) - Porter's Five Forces: Threat of new entrants
You're analyzing the barriers preventing fresh competition from walking right into Recon Technology, Ltd.'s established turf. Honestly, the hurdles here are pretty substantial, especially given the nature of the Chinese oil and gas service sector.
- - High capital investment is required for specialized oilfield equipment and environmental protection projects.
- - Strong existing relationships with state-owned customers (Sinopec, CNPC) create a significant barrier to entry.
- - The company's net loss of RMB 44.2 million in FY2025 makes the market unattractive for new entrants.
- - Government regulations and licensing for oil and gas operations in China pose a major hurdle.
The sheer scale of necessary upfront spending acts as a natural moat. Getting into the specialized oilfield equipment or large-scale environmental protection project space demands massive financial backing for machinery and infrastructure. New players don't just need capital; they need it in amounts that scare off most venture-backed startups.
To be fair, Recon Technology, Ltd.'s existing customer base is a huge deterrent. They supply China's largest oil exploration companies, Sinopec (NYSE: SNP) and The China National Petroleum Corporation ('CNPC'), and have developed stable, long-term cooperation relationships with these giants. Displacing an incumbent with proven, long-standing ties to state-owned enterprises (SOEs) is incredibly tough for an outsider.
Also, the recent financial performance doesn't exactly scream 'easy money' for newcomers. For the fiscal year ended June 30, 2025, Recon Technology, Ltd. posted a net loss of RMB 44.2 million ($6.2 million). When a market incumbent is posting significant losses, it signals high operational risk and low immediate profitability, which definitely makes the market less appealing for new capital looking for quick wins.
Plus, you can't ignore the regulatory landscape. China's first Energy Law came into effect on January 1, 2025, aiming to balance energy security with a green transition, which means any new entrant must navigate a complex, unified energy framework. Furthermore, finalized measures for oil and gas infrastructure management are set to take effect on January 1, 2026, which will integrate network management and affect how new players can access infrastructure. While the government is encouraging private investment in some areas, exploration licensing remains generally limited, creating a bottleneck for upstream entrants.
Here's a quick look at the financial context and the key customer relationships that define this barrier:
| Metric | Value (FY2025) | Notes |
|---|---|---|
| Net Loss | RMB 44.2 million | Year ended June 30, 2025 |
| Total Revenue | RMB 66.3 million | Year ended June 30, 2025 |
| Gross Margin | 23.0% | Year ended June 30, 2025 |
| Key Customers | Sinopec and CNPC | Stable, long-term cooperation established |
What this estimate hides is the specific cost of entry for, say, a new environmental services firm versus an automation software provider; the capital needs definitely vary by segment, but all require significant scale to compete effectively against Recon Technology, Ltd.'s installed base.
Finance: draft 13-week cash view by Friday.
Disclaimer
All information, articles, and product details provided on this website are for general informational and educational purposes only. We do not claim any ownership over, nor do we intend to infringe upon, any trademarks, copyrights, logos, brand names, or other intellectual property mentioned or depicted on this site. Such intellectual property remains the property of its respective owners, and any references here are made solely for identification or informational purposes, without implying any affiliation, endorsement, or partnership.
We make no representations or warranties, express or implied, regarding the accuracy, completeness, or suitability of any content or products presented. Nothing on this website should be construed as legal, tax, investment, financial, medical, or other professional advice. In addition, no part of this site—including articles or product references—constitutes a solicitation, recommendation, endorsement, advertisement, or offer to buy or sell any securities, franchises, or other financial instruments, particularly in jurisdictions where such activity would be unlawful.
All content is of a general nature and may not address the specific circumstances of any individual or entity. It is not a substitute for professional advice or services. Any actions you take based on the information provided here are strictly at your own risk. You accept full responsibility for any decisions or outcomes arising from your use of this website and agree to release us from any liability in connection with your use of, or reliance upon, the content or products found herein.