
|
Recon Technology, Ltd. (RCON): SWOT Analysis [Nov-2025 Updated] |
Fully Editable: Tailor To Your Needs In Excel Or Sheets
Professional Design: Trusted, Industry-Standard Templates
Investor-Approved Valuation Models
MAC/PC Compatible, Fully Unlocked
No Expertise Is Needed; Easy To Follow
Recon Technology, Ltd. (RCON) Bundle
You're looking at Recon Technology, Ltd. (RCON), and the picture is complex: a strong technical niche in China's critical oilfield automation is battling serious financial headwinds and geopolitical risk. While RCON benefits from established state-owned client relationships and proprietary technology, its tiny revenue base-just around $3.6 million in the last fiscal year-and persistent net losses make sustained profitability a serious concern. This is a classic micro-cap situation where internal strengths are defintely overshadowed by market volatility and the looming threat of NASDAQ delisting. Let's map the near-term risks and opportunities to clear actions.
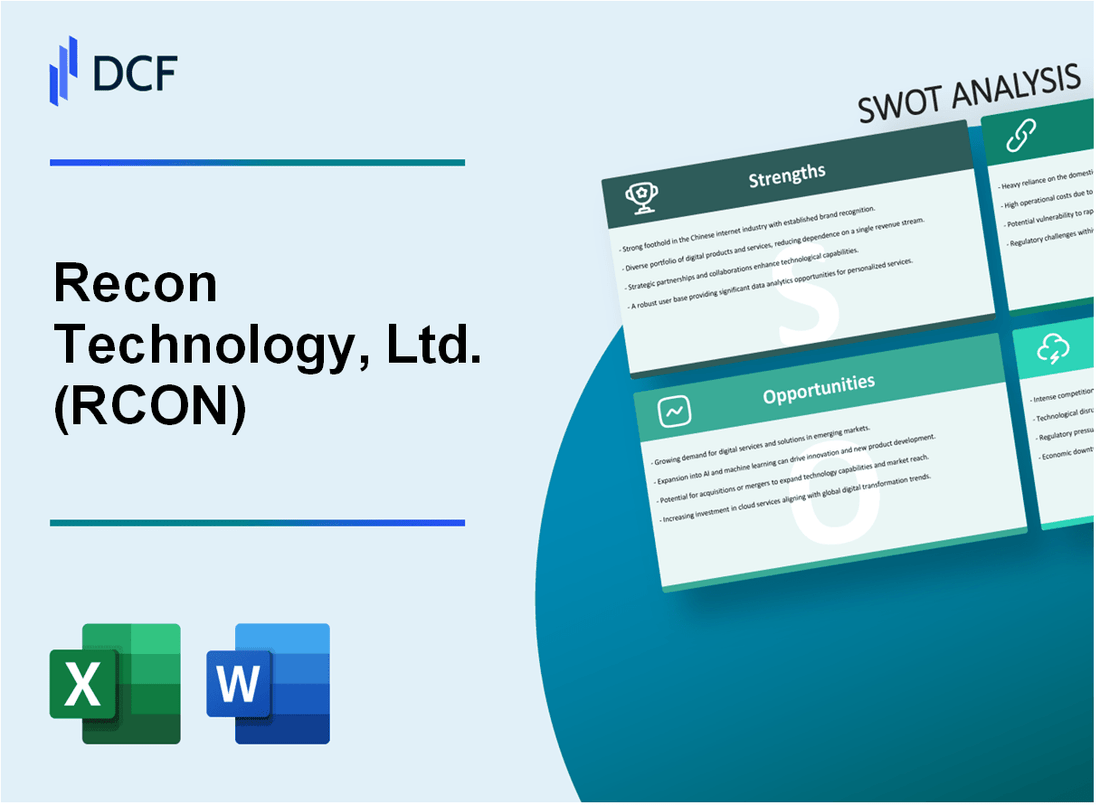
Recon Technology, Ltd. (RCON) - SWOT Analysis: Strengths
Niche Focus on Automation and Information Management for Chinese Oilfields
Recon Technology, Ltd. is a specialized solutions integrator, which is a real strength in a market dominated by massive state-owned enterprises. You're not trying to compete everywhere; you're focused on providing high-value automation systems and software tailored for the Chinese oil and gas industry. This niche focus on digital transformation-specifically Supervisory Control and Data Acquisition (SCADA) systems and Internet of Things (IoT) solutions-is where the market is heading. This strategy is paying off in their core technology segment.
For the fiscal year ended June 30, 2025, revenue from your Automation Product and Software segment increased by 27.1%, adding approximately $1.0 million in revenue. That's a clear signal you're solving a critical, high-demand problem for your clients: improving operational efficiency and data management at the wellhead.
Established Relationships with Major State-Owned Energy Companies in China
Your long-term relationships with China's largest oil exploration companies are your most defintely valuable asset. In China's energy sector, access and trust are everything, and you have established stable, long-term cooperation with the key players.
You supply advanced automated technologies and equipment to Sinopec and The China National Petroleum Corporation (CNPC). These are not just any clients; they are the backbone of China's energy infrastructure. This access provides a consistent revenue base and a high barrier to entry for competitors.
The trust built through these relationships extends beyond China, as evidenced by the $5.85 million contract secured in August 2025 to upgrade and retrofit automation systems for a large Asian gas field. That's a huge vote of confidence in your capabilities for a company of your size.
Proprietary Technology in Oil and Gas Production and Pipeline Safety Monitoring
Your proprietary technology portfolio gives you a competitive edge, especially in the push for greater oilfield digitalization. This isn't just off-the-shelf hardware; it's specialized equipment and software that directly impacts production levels and safety.
Your core product offerings are centered on real-time data acquisition and control, which is essential for modern reservoir management.
- Pumping Unit Controllers: Optimizing extraction efficiency.
- Natural Gas Flow Computer Systems: Precise measurement for custody transfer.
- Wireless Dynamometers and Pressure Gauges: Real-time, remote monitoring.
- Oilfield Monitor and Data Acquisition Systems: Centralized information management.
This technology focus is why the gross profit from your Automation Product and Software segment increased by 84.9% in FY2025, reaching approximately $0.8 million from $0.4 million in FY2024. The market is rewarding your high-margin, technology-driven services.
Low Debt-to-Equity Ratio, Providing Financial Flexibility for a Micro-Cap
For a micro-cap company, a clean balance sheet is a massive strength-it shows you can weather market volatility and pursue new opportunities without crushing debt payments. Your financial position is remarkably conservative, especially compared to the broader energy sector.
Here's the quick math: Your Debt-to-Equity (D/E) ratio for the fiscal year ended June 30, 2025, was approximately 7.4% (or 0.08 as reported by some sources). To be fair, the average D/E for companies in the Energy sector is much higher, around 69.7%. This low leverage gives you significant financial runway.
This capital structure is a huge advantage, as it provides flexibility for strategic moves, like your new chemical recycling business, which started construction in April 2025. Your current ratio of 5.88 and quick ratio of 3.19 as of the most recent quarter also indicate strong short-term liquidity, meaning you have plenty of non-cash assets to cover near-term obligations.
| Key Financial Strength Metric (FY 2025) | Value (USD/Ratio) | Implication |
|---|---|---|
| Total Revenue (FY ended June 30, 2025) | $9.3 million | Slightly down but highlights scale. |
| Debt-to-Equity Ratio (FY 2025) | 7.4% (or 0.08) | Extremely low financial leverage. |
| Current Ratio (MRQ) | 5.88 | Excellent short-term liquidity. |
| Automation & Software Revenue Growth (FY 2025 YoY) | 27.1% | Strong growth in core technology segment. |
| Cash Position (June 30, 2025) | RMB98.9 million | Solid cash reserves for a micro-cap. |
Recon Technology, Ltd. (RCON) - SWOT Analysis: Weaknesses
Extremely Small Revenue Base
You need to see the revenue base for what it is: tiny for a NASDAQ-listed company. Recon Technology, Ltd.'s total revenue for the fiscal year ended June 30, 2025, was approximately RMB 66.3 million, which translates to only about $9.3 million. This is a marginal figure in the oilfield services sector, especially when compared to industry giants. This small base makes the company highly susceptible to minor market shifts or the loss of a single contract, which can drastically impact the top line.
Here's the quick math: a 10% drop in sales is only a $0.93 million loss, but that represents a huge percentage of their total operating capacity. This lack of scale also limits their ability to compete on price with larger, more established players. It's a tough place to be.
High Customer Concentration; Reliance on a Few Large State-Owned Enterprises
The company's revenue is heavily concentrated among a handful of key clients, which are predominantly large Chinese state-owned enterprises (SOEs). This is a major risk because a small number of customers hold significant negotiating power and can dictate terms or pricing.
For the fiscal year 2025, two state-owned entities accounted for the vast majority of Recon Technology, Ltd.'s sales. Losing even one of these contracts would be a catastrophic blow to the business.
- China National Petroleum Corporation (CNPC) represented 44% of total revenue.
- China Petroleum & Chemical Corporation (Sinopec) represented 17% of total revenue.
Honestly, a 61% revenue reliance on just two customers is defintely a precarious position. Plus, the capital expenditure decisions of these SOEs are often tied to national policy and oil price fluctuations, which are factors Recon Technology, Ltd. cannot control.
Persistent Net Losses, Making Sustained Profitability a Serious Concern
Recon Technology, Ltd. has a chronic issue with profitability, consistently reporting net losses year after year. For the fiscal year ended June 30, 2025, the company reported a net loss of approximately RMB 44.2 million, or about $6.2 million. This follows a net loss of approximately $7.1 million in the prior fiscal year (FY2024).
This persistent negative bottom line means the company is burning through capital, not generating it. To be fair, they did reduce the loss from the previous year, but a loss is still a loss. The market needs to see a clear path to generating a profit, not just a smaller deficit. Here is a snapshot of the recent loss trend:
| Fiscal Year Ended June 30 | Net Loss (in USD millions) |
|---|---|
| 2025 | $6.2 million |
| 2024 | $7.1 million |
Limited Cash Reserves to Fund Large-Scale R&D or Market Expansion
While the company does hold some cash, the reserves are limited relative to the cost of significant research and development (R&D) or aggressive market expansion efforts. As of June 30, 2025, Recon Technology, Ltd. reported cash of approximately $13.8 million and short-term investments of about $0.5 million. This cash position is not a deep well for funding major strategic shifts.
What this estimate hides is the negative cash flow from operations. The company's trailing twelve months (TTM) free cash flow was negative $6.15 million, meaning they are spending more cash to run the business and maintain assets than they are bringing in. This negative outflow restricts their ability to invest in new technologies or expand geographically without raising additional capital, which dilutes existing shareholder value. They are in a capital-constrained environment.
Recon Technology, Ltd. (RCON) - SWOT Analysis: Opportunities
Increased national focus in China on energy security and domestic production efficiency.
You can't ignore the macro-level shift in Beijing: national energy security is the top priority, and that's a direct tailwind for Recon Technology, Ltd. (RCON). The new Energy Law, effective January 1, 2025, explicitly mandates increasing domestic oil and gas exploration and promoting the development of unconventional resources like shale gas. This isn't just rhetoric; it translates into capital expenditure by your primary clients, China National Petroleum Corporation (CNPC) and Sinopec.
The government's 'Seven-Year Action Plan for Oil and Gas Reserve and Production Growth' has already pushed China's crude oil production from 189 million tonnes in 2018 to 213 million tonnes in 2024, and natural gas production is up significantly too. This persistent push for domestic output means a guaranteed demand floor for RCON's services aimed at maximizing extraction and efficiency. Honestly, the focus on self-sufficiency is defintely the most stable, long-term opportunity you have.
Digital transformation of oilfields (Oilfield Internet of Things) driving demand for RCON's core services.
The digital oilfield (or Oilfield Internet of Things) market in China is not a future trend; it's a current, high-growth reality that plays directly to RCON's strengths in automation and software. This market is predicted to be worth approximately USD 3.47 billion in 2025, with some analysts projecting a Compound Annual Growth Rate (CAGR) of 9.22% from 2025 through 2032.
RCON is already seeing this opportunity reflected in its segment performance. For the fiscal year ended June 30, 2025, the company's revenue from automation product and software increased by 27.1%, or approximately RMB 7.3 million ($1.0 million). This is a high-margin area, so the company needs to double down here. It's a clear path to boosting the overall gross margin, which sat at 23.0% for FY2025.
The market growth is driven by a need for efficiency, especially in mature fields, and RCON's core offerings fit this perfectly:
- Deploying AI and big data for reservoir management.
- Implementing real-time monitoring for predictive maintenance.
- Automating wellhead operations to reduce labor costs.
Potential for strategic acquisitions to quickly expand service offerings or geographic reach.
Given the company's stated strategic transformation plan from 2021 to explore the renewable energy sector and seek suitable technology acquisitions, there is a clear mandate for inorganic growth. While the company reported a net loss of RMB 44.2 million ($6.2 million) in FY2025, its balance sheet shows total assets of RMB 525.6 million and a low long-term debt to capital ratio, suggesting fiscal prudence and capacity for targeted M&A.
An acquisition strategy could be used to diversify away from the high customer concentration-CNPC and Sinopec accounted for 44% and 17% of FY2025 revenue, respectively. Acquiring a smaller, high-margin software firm or a specialized environmental service provider could immediately expand RCON's market footprint and reduce reliance on just two state-owned giants. This is how you mitigate client risk fast.
Government initiatives to modernize aging infrastructure in mature oil and gas fields.
The Chinese government has a massive, unmet infrastructure need that RCON is well-positioned to address. The National Development and Reform Commission (NDRC) has prioritized expanding natural gas pipeline and storage infrastructure in 2025. Here's the quick math on the gap:
| Metric | 14th Five-Year Plan Target (2025) | Actual Capacity (End of 2024) | Shortfall |
|---|---|---|---|
| Integrated Gas Storage Capacity | 55-60 Bcm | Approximately 26.7 Bcm | 51% - 55% |
This deficit of over 28 Bcm in storage capacity alone means the national oil companies must accelerate construction and modernization efforts, creating significant near-term contracts for RCON's equipment, automation, and platform services. Furthermore, new regulations taking effect in January 2026 will integrate the management of crude, oil products, and natural gas networks, which will drive demand for RCON's systems integration and software solutions to link these previously disparate networks.
Recon Technology, Ltd. (RCON) - SWOT Analysis: Threats
You're looking at Recon Technology, Ltd. (RCON) and need to map out the near-term risks, and honestly, the threats are both macroeconomic and very company-specific. The biggest challenges stem from the company's reliance on China's state-owned oil giants and its precarious position on the NASDAQ.
Geopolitical Tensions Between the US and China
The escalating trade and geopolitical tensions between the world's two largest economies, the US and China, create a perpetual risk for any US-listed Chinese company. This conflict primarily impacts the global economy and oil demand outlook, leading to significant market volatility. While RCON operates almost entirely within China, its NASDAQ listing makes it a direct target of regulatory scrutiny and investor risk aversion.
When the US government threatens new, heavy tariffs-some signaled as high as 100% on Chinese goods-it transmits negative signals that dampen global economic growth forecasts. This uncertainty directly impacts the energy sector, as seen historically during the US-China trade war where the oil and gas sector experienced negative impacts. The risk here is two-fold:
- Regulatory Scrutiny: Increased political pressure on US regulators to tighten financial oversight of Chinese companies.
- Demand Shock: A global economic slowdown, triggered by trade friction, reduces overall crude oil demand, which pressures RCON's primary clients.
Regulatory Changes by the Chinese Government Affecting State-Owned Enterprise Spending
RCON's primary clients are China's domestic oil companies, which are large state-owned enterprises (SOEs) like PetroChina, Sinopec, and CNOOC. The Chinese government is actively reforming the SOE sector, pushing for greater commercial viability and a shift in capital allocation.
The State-owned Assets Supervision and Administration Commission of the State Council (SASAC) is encouraging central SOEs to focus investment on 'strategic emerging industries,' which include energy-saving and environmental protection. While RCON's services touch on these areas, this shift means traditional oilfield services compete for a capital expenditure (CapEx) budget that is increasingly being redirected to new, high-tech areas.
A new regulation, the 'Measures for the Planning, Construction, and Operation Management of Oil and Gas Infrastructure,' was finalized in November 2025, effective January 1, 2026. This mandates that national oil companies maintain gas storage equivalent to only 5% of their annual supply volume, down from the previous 10%. This kind of policy-driven change can instantly alter the scope and budget for RCON's infrastructure-related service contracts.
Volatility in Global Crude Oil Prices Directly Impacting Client Capital Expenditure Budgets
This is the most direct and immediate threat to Recon Technology's financials. The company's performance is explicitly tied to the spending behavior of its SOE clients, which becomes 'cautious and cost-conscious' when oil prices fluctuate. The fiscal year 2025 results clearly show this impact, with the CEO noting that domestic oil companies experienced declining performance due to price volatility.
Here's the quick math: lower oil prices mean less CapEx for oilfield services like RCON's.
| Financial Metric | Fiscal Year 2024 (RMB) | Fiscal Year 2025 (RMB) | Year-over-Year Change |
|---|---|---|---|
| Total Revenue | RMB68.8 million | RMB66.3 million | Decrease of 3.7% |
| Gross Profit | RMB20.9 million | RMB15.2 million | Decrease of 27.3% |
| Gross Margin | 30.3% | 23.0% | Decrease of 7.3 percentage points |
For 2025, Brent crude prices were forecast to average around $66/bbl, a significant drop from the 2024 average of $84/b. This bearish price environment directly squeezed RCON's margins, causing gross profit to fall by over a quarter in a single year. That's a serious headwind.
Delisting Risk from NASDAQ Due to Non-Compliance with Minimum Bid Price Rules
The risk of delisting from the NASDAQ Capital Market remains a critical threat, severely limiting the company's access to US capital markets and investor visibility. Recon Technology received a Staff determination letter from NASDAQ on April 23, 2024, for failing to maintain the $1.00 minimum closing bid price. The company failed to regain compliance during the allotted 360-day period, which expired on April 22, 2024.
While the company appealed the determination to a Hearings Panel, which temporarily stayed the suspension, the underlying issue of maintaining the minimum bid price is persistent. The stock was trading around $1.17 recently, but this volatility is a constant concern.
Moreover, NASDAQ has been actively tightening its listing requirements. A proposed rule change submitted in September 2025 would accelerate the delisting process for any security that does not maintain a closing bid price of at least $0.10 for ten consecutive trading days. If approved, this new 'low price requirement' will remove the possibility of a stay during an appeal, making the path to delisting much faster and defintely more unforgiving. The market capitalization of RCON is already small, at around $14.44 million USD as of early 2024, which compounds the liquidity and compliance challenge.
Disclaimer
All information, articles, and product details provided on this website are for general informational and educational purposes only. We do not claim any ownership over, nor do we intend to infringe upon, any trademarks, copyrights, logos, brand names, or other intellectual property mentioned or depicted on this site. Such intellectual property remains the property of its respective owners, and any references here are made solely for identification or informational purposes, without implying any affiliation, endorsement, or partnership.
We make no representations or warranties, express or implied, regarding the accuracy, completeness, or suitability of any content or products presented. Nothing on this website should be construed as legal, tax, investment, financial, medical, or other professional advice. In addition, no part of this site—including articles or product references—constitutes a solicitation, recommendation, endorsement, advertisement, or offer to buy or sell any securities, franchises, or other financial instruments, particularly in jurisdictions where such activity would be unlawful.
All content is of a general nature and may not address the specific circumstances of any individual or entity. It is not a substitute for professional advice or services. Any actions you take based on the information provided here are strictly at your own risk. You accept full responsibility for any decisions or outcomes arising from your use of this website and agree to release us from any liability in connection with your use of, or reliance upon, the content or products found herein.