
|
Stellus Capital Investment Corporation (SCM) DCF Valuation |
Fully Editable: Tailor To Your Needs In Excel Or Sheets
Professional Design: Trusted, Industry-Standard Templates
Investor-Approved Valuation Models
MAC/PC Compatible, Fully Unlocked
No Expertise Is Needed; Easy To Follow
Stellus Capital Investment Corporation (SCM) Bundle
Streamline your analysis and boost precision with our (SCM) DCF Calculator! Utilizing actual data from Stellus Capital Investment Corporation and customizable assumptions, this tool empowers you to forecast, analyze, and value (SCM) like a seasoned investor.
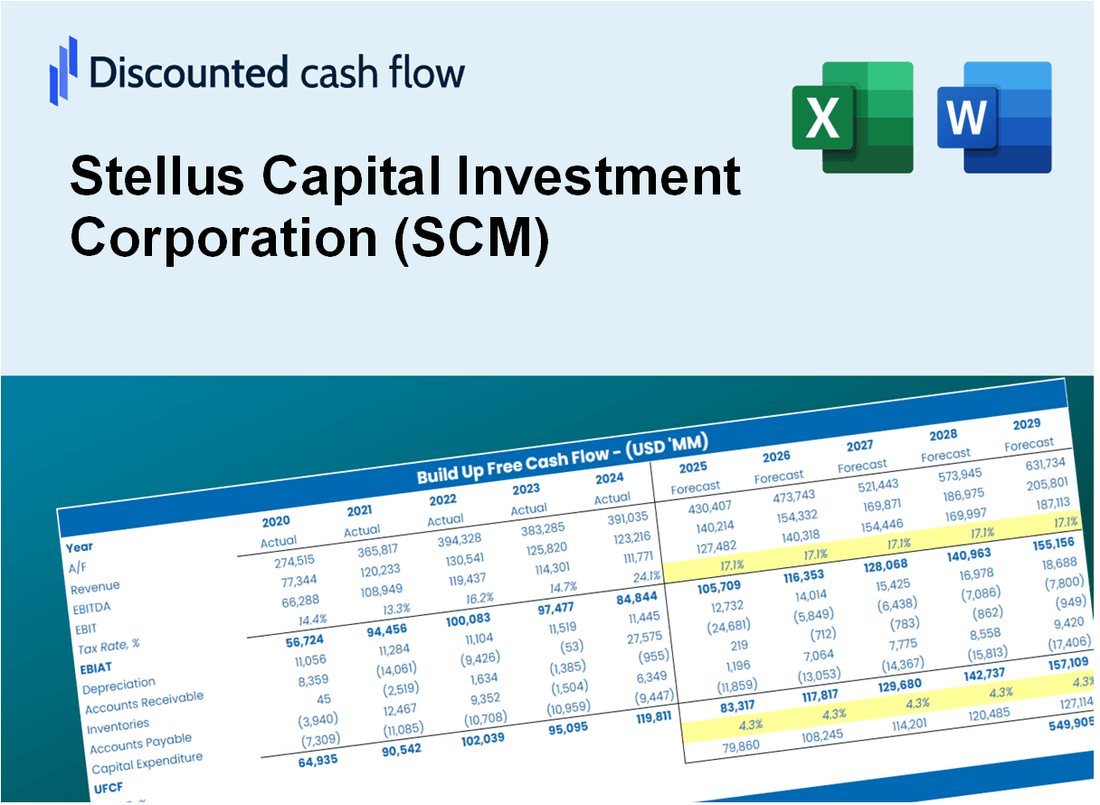
Discounted Cash Flow (DCF) - (USD MM)
| Year | AY1 2020 |
AY2 2021 |
AY3 2022 |
AY4 2023 |
AY5 2024 |
FY1 2025 |
FY2 2026 |
FY3 2027 |
FY4 2028 |
FY5 2029 |
|---|---|---|---|---|---|---|---|---|---|---|
| Revenue | 25.9 | 42.7 | 20.9 | 105.8 | 104.7 | 134.3 | 172.2 | 220.8 | 283.1 | 363.0 |
| Revenue Growth, % | 0 | 64.83 | -50.89 | 405.24 | -1.05 | 28.22 | 28.22 | 28.22 | 28.22 | 28.22 |
| EBITDA | 46.5 | .0 | 69.2 | .0 | 78.7 | 73.9 | 94.8 | 121.5 | 155.8 | 199.8 |
| EBITDA, % | 179.78 | 0 | 330.5 | 0 | 75.16 | 55.03 | 55.03 | 55.03 | 55.03 | 55.03 |
| Depreciation | 9.4 | 31.0 | 38.4 | -75.2 | 5.3 | 38.4 | 49.2 | 63.1 | 80.9 | 103.8 |
| Depreciation, % | 36.28 | 72.69 | 183.47 | -71.09 | 5.04 | 28.58 | 28.58 | 28.58 | 28.58 | 28.58 |
| EBIT | 37.1 | -31.0 | 30.8 | 75.2 | 73.4 | 72.1 | 92.5 | 118.6 | 152.0 | 194.9 |
| EBIT, % | 143.5 | -72.69 | 147.03 | 71.09 | 70.11 | 53.7 | 53.7 | 53.7 | 53.7 | 53.7 |
| Total Cash | 18.5 | 44.2 | 48.0 | 26.1 | 20.1 | 84.7 | 108.6 | 139.2 | 178.5 | 228.9 |
| Total Cash, percent | .0 | .0 | .0 | .0 | .0 | .0 | .0 | .0 | .0 | .0 |
| Account Receivables | 2.4 | 3.5 | 4.7 | 5.3 | 5.4 | 13.5 | 17.4 | 22.3 | 28.6 | 36.6 |
| Account Receivables, % | 9.39 | 8.29 | 22.61 | 5 | 5.13 | 10.09 | 10.09 | 10.09 | 10.09 | 10.09 |
| Inventories | .0 | .0 | .0 | .0 | .0 | .0 | .0 | .0 | .0 | .0 |
| Inventories, % | 0 | 0 | 0 | 0 | 0 | 0 | 0 | 0 | 0 | 0 |
| Accounts Payable | 2.1 | 4.9 | 4.6 | 5.2 | 8.9 | 14.9 | 19.1 | 24.4 | 31.3 | 40.2 |
| Accounts Payable, % | 8.28 | 11.4 | 22.15 | 4.95 | 8.54 | 11.07 | 11.07 | 11.07 | 11.07 | 11.07 |
| Capital Expenditure | .0 | .0 | .0 | .0 | .0 | .0 | .0 | .0 | .0 | .0 |
| Capital Expenditure, % | 0 | 0 | 0 | 0 | 0 | 0 | 0 | 0 | 0 | 0 |
| Tax Rate, % | 3.41 | 3.41 | 3.41 | 3.41 | 3.41 | 3.41 | 3.41 | 3.41 | 3.41 | 3.41 |
| EBITAT | 35.4 | -28.0 | 28.1 | 82.4 | 70.9 | 68.3 | 87.6 | 112.3 | 144.0 | 184.7 |
| Depreciation | ||||||||||
| Changes in Account Receivables | ||||||||||
| Changes in Inventories | ||||||||||
| Changes in Accounts Payable | ||||||||||
| Capital Expenditure | ||||||||||
| UFCF | 44.5 | 4.6 | 65.1 | 7.2 | 79.8 | 104.5 | 137.2 | 175.9 | 225.6 | 289.2 |
| WACC, % | 5.67 | 5.5 | 5.54 | 5.84 | 5.72 | 5.65 | 5.65 | 5.65 | 5.65 | 5.65 |
| PV UFCF | ||||||||||
| SUM PV UFCF | 771.6 | |||||||||
| Long Term Growth Rate, % | 2.00 | |||||||||
| Free cash flow (T + 1) | 295 | |||||||||
| Terminal Value | 8,071 | |||||||||
| Present Terminal Value | 6,131 | |||||||||
| Enterprise Value | 6,902 | |||||||||
| Net Debt | 573 | |||||||||
| Equity Value | 6,329 | |||||||||
| Diluted Shares Outstanding, MM | 26 | |||||||||
| Equity Value Per Share | 247.27 |
What You Will Receive
- Comprehensive Financial Model: Leverage Stellus Capital Investment Corporation’s (SCM) actual data for accurate DCF valuation.
- Complete Forecasting Control: Modify revenue growth, margins, WACC, and other essential parameters.
- Real-Time Calculations: Instantaneous updates ensure you view outcomes as you adjust inputs.
- Professional-Grade Template: A polished Excel file crafted for high-quality valuation presentations.
- Flexible and Reusable: Designed for adaptability, allowing for multiple uses in detailed forecasting.
Key Features
- Comprehensive DCF Calculator: Features detailed unlevered and levered DCF valuation models tailored for Stellus Capital Investment Corporation (SCM).
- WACC Calculator: Pre-configured Weighted Average Cost of Capital sheet with adjustable inputs for precise calculations.
- Customizable Forecast Assumptions: Easily modify growth projections, capital expenditures, and discount rates specific to SCM.
- Integrated Financial Ratios: Evaluate profitability, leverage, and efficiency ratios relevant to Stellus Capital Investment Corporation (SCM).
- Interactive Dashboard and Charts: Visual representations provide a summary of key valuation metrics for straightforward analysis.
How It Works
- Download the Template: Gain immediate access to the Excel-based SCM DCF Calculator.
- Input Your Assumptions: Modify the yellow-highlighted cells for growth rates, WACC, margins, and other variables.
- Instant Calculations: The model automatically recalculates Stellus Capital’s intrinsic value.
- Test Scenarios: Experiment with various assumptions to assess potential valuation shifts.
- Analyze and Decide: Utilize the outcomes to inform your investment or financial decisions.
Why Choose This Calculator for Stellus Capital Investment Corporation (SCM)?
- Accuracy: Utilizes real Stellus Capital financials for precise data.
- Flexibility: Allows users to easily adjust and experiment with inputs.
- Time-Saving: Eliminate the need to create a DCF model from the ground up.
- Professional-Grade: Crafted with the expertise and usability expected at the CFO level.
- User-Friendly: Intuitive interface suitable for users of all financial backgrounds.
Who Should Use This Product?
- Investors: Assess the fair value of Stellus Capital Investment Corporation (SCM) before making investment choices.
- CFOs: Utilize an advanced DCF model for accurate financial reporting and analysis.
- Consultants: Effortlessly customize the template for client valuation reports.
- Entrepreneurs: Discover financial modeling techniques employed by leading investment firms.
- Educators: Serve as a resource for teaching valuation strategies and methodologies.
What the Template Contains
- Pre-Filled DCF Model: Stellus Capital Investment Corporation’s (SCM) financial data preloaded for immediate use.
- WACC Calculator: Detailed calculations for Weighted Average Cost of Capital specific to (SCM).
- Financial Ratios: Analyze (SCM)’s profitability, leverage, and efficiency metrics.
- Editable Inputs: Modify assumptions such as growth rates, margins, and CAPEX tailored to your scenarios.
- Financial Statements: Access annual and quarterly reports for comprehensive analysis of (SCM).
- Interactive Dashboard: Effortlessly visualize key valuation metrics and results for (SCM).
Disclaimer
All information, articles, and product details provided on this website are for general informational and educational purposes only. We do not claim any ownership over, nor do we intend to infringe upon, any trademarks, copyrights, logos, brand names, or other intellectual property mentioned or depicted on this site. Such intellectual property remains the property of its respective owners, and any references here are made solely for identification or informational purposes, without implying any affiliation, endorsement, or partnership.
We make no representations or warranties, express or implied, regarding the accuracy, completeness, or suitability of any content or products presented. Nothing on this website should be construed as legal, tax, investment, financial, medical, or other professional advice. In addition, no part of this site—including articles or product references—constitutes a solicitation, recommendation, endorsement, advertisement, or offer to buy or sell any securities, franchises, or other financial instruments, particularly in jurisdictions where such activity would be unlawful.
All content is of a general nature and may not address the specific circumstances of any individual or entity. It is not a substitute for professional advice or services. Any actions you take based on the information provided here are strictly at your own risk. You accept full responsibility for any decisions or outcomes arising from your use of this website and agree to release us from any liability in connection with your use of, or reliance upon, the content or products found herein.