
|
Seneca Foods Corporation (SENEB): ANSOFF MATRIX [Dec-2025 Updated] |
Fully Editable: Tailor To Your Needs In Excel Or Sheets
Professional Design: Trusted, Industry-Standard Templates
Investor-Approved Valuation Models
MAC/PC Compatible, Fully Unlocked
No Expertise Is Needed; Easy To Follow
Seneca Foods Corporation (SENEB) Bundle
You've seen the numbers: Seneca Foods Corporation closed fiscal 2025 with net sales hitting a solid $1,578.9 million, but honestly, that thin 9.5% gross margin is the real story you need to fix now. As someone who's mapped strategy for two decades, I can tell you that simply pushing more licensed brands isn't enough; we need deliberate moves. This Ansoff Matrix cuts through the noise, laying out exactly how Seneca Foods Corporation can attack growth-whether it's doubling down on existing markets, pushing those canned vegetables (which are 83% of food sales) into new spots like Asia, innovating that small 8% frozen segment, or even making a bold leap into plant-based proteins. Let's look at the four clear paths to turn that revenue into real profit.
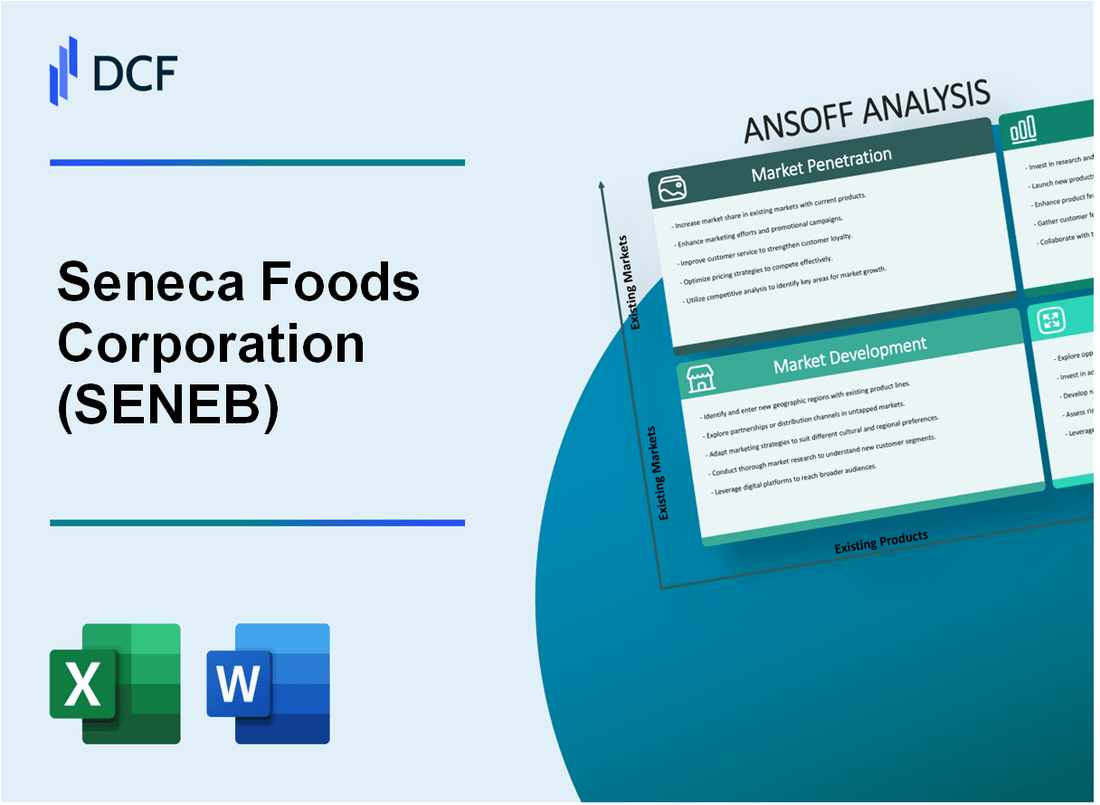
Seneca Foods Corporation (SENEB) - Ansoff Matrix: Market Penetration
You're looking at how Seneca Foods Corporation is pushing harder into its existing markets-the core of Market Penetration. This means selling more of what you already make to the customers you already serve. The focus here is on volume and margin recovery in a tough environment.
The immediate financial pressure point is margin optimization. The gross margin as a percentage of net sales for the twelve months ended March 31, 2025, fell to 9.5%, a significant drop from 12.9% the prior year. This necessitates aggressive pricing strategy reviews to recover profitability, especially since the fourth quarter gross margin was even lower at 4.5%.
Driving higher unit volume sales remains a key lever, as this was the primary factor in the fiscal 2025 revenue increase. For the twelve months ended March 31, 2025, net sales grew by $120.3 million year-over-year, reaching $1,578.9 million, which was driven by those higher sales volumes. For the third quarter of that fiscal year, the company noted strong unit volume sales growth of over 16% compared to the previous year.
For licensed brands like Green Giant®, the strategy involves boosting volume through promotional spending. Seneca Foods Corporation acquired the U.S. shelf-stable Green Giant® line for $55.2 million in cash, which included inventory valued at $52.5 million. This investment in a known brand is meant to capture more shelf space and consumer dollars within the existing market.
Securing new private label contracts is another critical path. Seneca Foods Corporation holds a large share of the market for retail private label business. To put that into perspective, a substantial 87% of packaged foods were sold under segments including private labels, food service, and restaurant chains in fiscal year 2025. Deepening these relationships with existing Food Service and National Chain Accounts is essential for consistent volume. For instance, a contract with the USDA Agricultural Marketing Service for food donations showed an award amount of $901,720.52 as of September/November 2025, illustrating the scale of government/institutional business to maintain.
Here's a quick look at the key financial context for Seneca Foods Corporation during this push:
| Metric | FY 2025 (12 Months Ended Mar 31, 2025) | Prior Year (12 Months Ended Mar 31, 2024) |
| Net Sales | $1,578.9 million | $1,458.6 million |
| Gross Margin Percentage | 9.5% | 12.9% |
| Net Debt Reduction | $297 million | N/A (Year-over-year reduction) |
| Net Earnings | $41.2 million | $63.3 million |
The push for volume needs to be carefully managed against cost. The company is working through the impact of the high-cost 2024 pack inventory weighing on margins. The strategy requires that any promotional spending or pricing adjustments must be precisely calibrated to ensure the volume gains translate into margin recovery, not just revenue growth. If onboarding takes 14+ days, churn risk rises, so speed in contract fulfillment is defintely key.
The focus for Market Penetration is clearly on execution against these existing channels:
- Increase promotional spending on licensed brands like Green Giant® to boost volume.
- Aggressively secure new private label contracts with US mass merchandisers and club stores.
- Optimize pricing strategies to recover the gross margin, which fell to 9.5% in FY 2025.
- Deepen strategic relationships with existing Food Service and National Chain Accounts.
- Drive higher unit volume sales, a key factor in the FY 2025 revenue increase.
Finance: draft 13-week cash view by Friday.
Seneca Foods Corporation (SENEB) - Ansoff Matrix: Market Development
You're looking at how Seneca Foods Corporation can take its existing food products into new geographic areas. This is Market Development, and we have some solid numbers from fiscal year 2025 to frame the potential.
The current international footprint covers approximately 55 countries. The goal here is targeting new export markets in Asia and Africa, building on that existing base. For context on what you're expanding, the total net sales for the twelve months ended March 31, 2025, reached $1,578.9 million.
The core offering, canned vegetables, is the clear engine for this move, representing 83% of food sales in fiscal year 2025. Expanding these specific sales into new Latin American retail chains means pushing the largest revenue driver into fresh territory. Food operations overall accounted for 98% of total net sales in fiscal year 2025.
Here's the quick math on the food segment breakdown for the fiscal year ended March 31, 2025:
| Product Category | Net Sales (in thousands) | Percentage of Food Sales |
| Canned vegetables | $1,314,315 | 83% |
| Frozen vegetables | $124,714 | 8% |
| Fruit products | $92,378 | 6% |
| Snack products | $14,995 | 1% |
You're also looking at establishing a dedicated sales channel for large-scale international government and NGO feeding programs. Seneca Foods already sells to federal, state, and local governments for school and other food programs, so this is about formalizing and scaling that specific government/aid channel internationally. The company employed approximately 2,885 people as of March 31, 2025, which supports the logistics backbone for any expansion.
Leveraging the existing logistics network to enter new US regional markets currently underserved by Seneca Foods Corporation is a domestic play within this quadrant. The company's products are sold nationwide by major grocery outlets, including supermarkets, mass merchandisers, club stores, and dollar stores. This strategy focuses on filling gaps where current distribution, which covers the entire US, is not fully optimized.
Finally, increasing industrial customer sales for ingredients in Europe uses existing fruit and vegetable products. This leverages the production base that generated $1,314,315 thousand in canned vegetable sales in fiscal 2025 alone. The gross margin as a percentage of net sales for the full fiscal year 2025 was 9.5%.
The growth in net sales from fiscal 2024 to fiscal 2025 was $120.3 million, bringing total net sales to $1,578.9 million.
Seneca Foods Corporation (SENEB) - Ansoff Matrix: Product Development
You're looking at how Seneca Foods Corporation can grow by introducing new items into its existing markets, which is the Product Development strategy in the Ansoff Matrix. This means leveraging the established Seneca® brand and distribution network to push innovation where you already sell. Honestly, the numbers show where the biggest opportunities are for new product investment, especially outside of the core canned vegetable business.
For context on the current business scale, look at the latest full-year segment sales data. Canned vegetables still dominate, but the smaller categories are where you're aiming for higher growth rates through new offerings. For instance, in fiscal year 2024, frozen vegetables made up about 8% of total food packaging net sales, while fruit products were at 6%, and snack products were just 1%. That small snack base definitely has room to run.
Here's a quick look at the absolute sales dollars for these key areas in the most recent fiscal year, which was fiscal year 2025, ending March 31, 2025, compared to the prior year. Total net sales for Seneca Foods Corporation hit $1,578.9 million in fiscal year 2025, up from $1,458.6 million in fiscal year 2024.
| Product Category | FY 2025 Net Sales (in thousands) | FY 2024 Net Sales (in thousands) |
| Frozen vegetables | $124,714 | $120,795 |
| Fruit products | $92,378 | $87,435 |
| Snack products | $14,995 | $13,400 |
The Product Development thrust for Seneca Foods Corporation centers on specific, actionable launches designed to capture more share in these non-canned categories. You need to focus R&D dollars where the consumer trend is moving, which is often toward premiumization and convenience.
The required product development initiatives look like this:
- Launch a new line of premium, organic, shelf-stable vegetables under the Seneca® brand.
- Introduce new frozen vegetable blends and meal kits to grow the 8% frozen segment.
- Develop innovative, low-sugar fruit snack cups to revitalize the 6% fruit products category.
- Create a new line of branded, baked vegetable chips to expand the small but growing snack segment.
- Offer co-pack customers new, sustainable packaging formats like pouches or cartons for existing products.
To be fair, the margin pressure you saw in fiscal year 2025-where gross margin fell to 9.5% from 12.9% the year before-definitely means new product introductions must have a strong pricing power or cost advantage built in. The good news is that the company reduced net debt by $297 million year-over-year in fiscal 2025, which frees up capital for these strategic investments. You're funding growth from a stronger balance sheet, even if net earnings dropped to $41.2 million in fiscal 2025 from $63.3 million in fiscal 2024. Finance: draft 13-week cash view by Friday.
Seneca Foods Corporation (SENEB) - Ansoff Matrix: Diversification
You're looking at how Seneca Foods Corporation, which saw net sales of $1,578.9 million for the twelve months ended March 31, 2025, can move beyond its core, where canned vegetables accounted for 83% of its food packaging net sales in fiscal year 2025. That strong sales performance, up $120.3 million year-over-year, shows demand exists, but the gross margin pressure-down to 9.5% in fiscal 2025 from 12.9% the prior year-definitely signals a need to explore new, potentially higher-margin avenues through diversification.
Consider acquiring a small, defintely innovative plant-based protein company to enter the alternative meat market. This isn't a small pond; the United States meat substitute market is estimated to reach $2.46 billion in 2025. Seneca Foods already deals in vegetable sourcing, so the raw material pipeline isn't entirely foreign, but the technology and branding are new territory. Textured vegetable protein, a key component, led the US market with a 57.15% share in 2024.
Next, think about investing in a new business segment providing specialized logistics and cold storage services to third-party food companies. This leverages the inherent need for temperature control in Seneca Foods Corporation's frozen vegetable segment (8% of food packaging sales in FY2025). The US Food Cold Chain Logistics Market is estimated at $393.2 billion in 2025, with the Food & Beverage application holding a 38.6% share. Building out third-party capacity could turn a necessary internal cost center into a revenue stream, especially since the US Cold Storage Market is projected to hit $104.75 billion by 2032.
Leveraging the non-food packaging segment, which made up 2% of Seneca Foods Corporation's total net sales in fiscal year 2025, to offer contract manufacturing for non-food CPG goods is a play on existing asset utilization. The broader US Food Contract Manufacturing & Services Market reached $138.22 billion in 2024. While Seneca's current packaged foods are mostly sold via private labels or food service (87% of packaged foods), shifting some can/end production capacity to non-food CPG could diversify the revenue base away from volatile agricultural inputs.
Entering the ready-to-eat (RTE) soup or broth market uses existing vegetable sourcing and processing capabilities directly. The US soup market size was valued at $4.95 billion in 2024, and RTE wet soups held the largest share at 28.8% in 2024. The global RTE Soup Market was valued at $1.38 billion in 2025. This move is less of a leap than plant-based meat, as it utilizes current vegetable streams, but it requires new formulation and shelf-stable packaging expertise beyond the 83% canned vegetable focus.
Finally, establishing a joint venture for high-tech indoor farming secures a year-round, high-margin fresh produce supply. This directly addresses the margin pressure Seneca faced in fiscal 2025, partly due to the poor 2024 pack season. The global Indoor Farming Technology Market is estimated between $37.22 billion and $49.4 billion in 2025, with growth driven by the need for predictable yields insulated from weather shocks. Securing supply this way could stabilize input costs, which is critical when net earnings fell to $41.2 million in FY2025.
Here's a quick look at how these diversification targets compare to Seneca Foods Corporation's current profile:
| Diversification Target | Relevant Market Size (2025 Est.) | Seneca Foods FY2025 Net Sales | Seneca Foods FY2025 Gross Margin % |
| Alternative Meat Company Acquisition | US Market: $2.46 billion | $1,578.9 million | 9.5% |
| Third-Party Cold Storage Business | US Food Cold Chain Logistics: $393.2 billion | $1,578.9 million | 9.5% |
| Non-Food CPG Contract Manufacturing | North America Food Contract Manufacturing Share: 38% of global revenue | Non-Food Packaging Sales: 2% of total net sales | 9.5% |
| RTE Soup/Broth Market Entry | Global RTE Soup Market: $1.38 billion | Canned Vegetables Sales: 83% of food packaging sales | 9.5% |
| High-Tech Indoor Farming JV | Global Indoor Farming Market: Range $37.22B - $49.4B | Net Debt Reduction: $297 million | 9.5% |
The company's ability to reduce net debt by $297 million year-over-year shows strong cash flow generation, which could fund these capital-intensive diversification moves. Still, the reliance on private labels and food service, accounting for 87% of packaged food sales, means any new venture must offer a clear path to higher-margin, branded revenue.
Disclaimer
All information, articles, and product details provided on this website are for general informational and educational purposes only. We do not claim any ownership over, nor do we intend to infringe upon, any trademarks, copyrights, logos, brand names, or other intellectual property mentioned or depicted on this site. Such intellectual property remains the property of its respective owners, and any references here are made solely for identification or informational purposes, without implying any affiliation, endorsement, or partnership.
We make no representations or warranties, express or implied, regarding the accuracy, completeness, or suitability of any content or products presented. Nothing on this website should be construed as legal, tax, investment, financial, medical, or other professional advice. In addition, no part of this site—including articles or product references—constitutes a solicitation, recommendation, endorsement, advertisement, or offer to buy or sell any securities, franchises, or other financial instruments, particularly in jurisdictions where such activity would be unlawful.
All content is of a general nature and may not address the specific circumstances of any individual or entity. It is not a substitute for professional advice or services. Any actions you take based on the information provided here are strictly at your own risk. You accept full responsibility for any decisions or outcomes arising from your use of this website and agree to release us from any liability in connection with your use of, or reliance upon, the content or products found herein.