
|
Seneca Foods Corporation (SENEB): 5 FORCES Analysis [Nov-2025 Updated] |
Fully Editable: Tailor To Your Needs In Excel Or Sheets
Professional Design: Trusted, Industry-Standard Templates
Investor-Approved Valuation Models
MAC/PC Compatible, Fully Unlocked
No Expertise Is Needed; Easy To Follow
Seneca Foods Corporation (SENEB) Bundle
You're digging into Seneca Foods Corporation, and frankly, the landscape as of late 2025 looks like a classic case of scale meeting intense market friction. While the company's vertical integration and its network of roughly 1,600 American growers give it a solid base, the real story is customer power: with 87% of sales going to private label or foodservice, major retailers are dictating terms, which is why the gross margin fell to a tight 9.5% in FY2025. Still, the barriers to entry are high, but you need to see how the threat from fresher substitutes stacks up against this intense rivalry. Below, we'll map out all five forces to give you a clear picture of the operational tightrope Seneca Foods Corporation is walking right now.
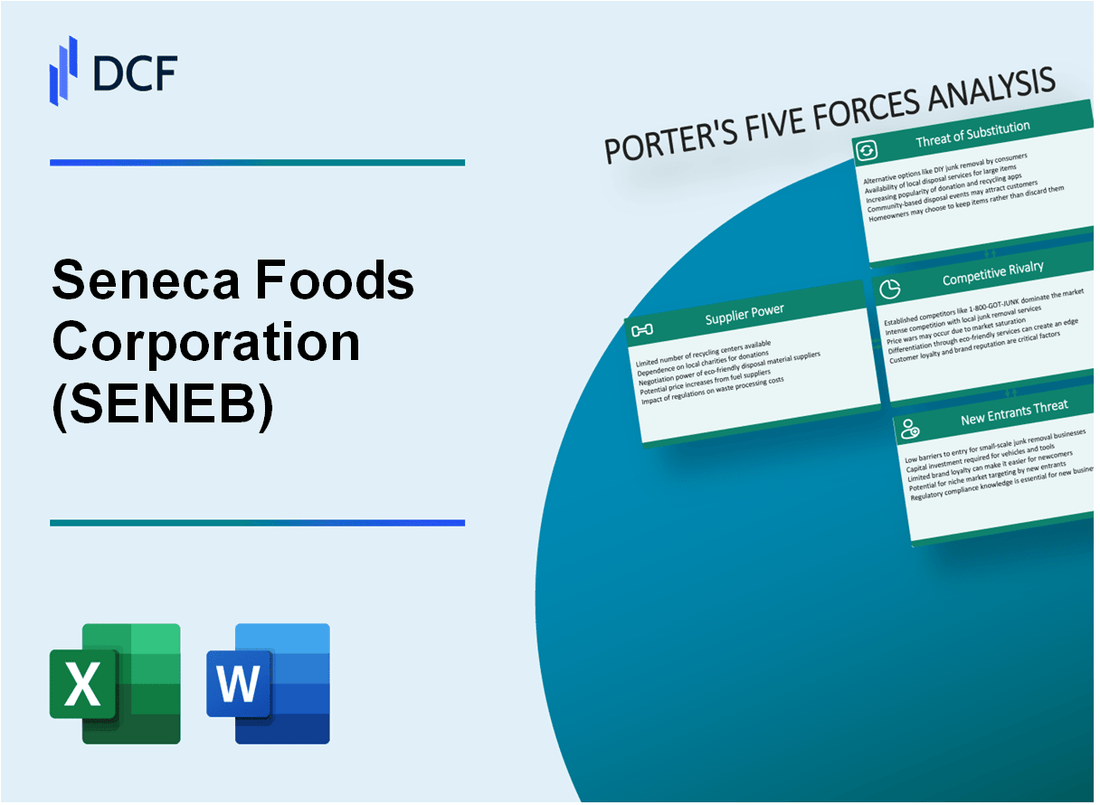
Seneca Foods Corporation (SENEB) - Porter's Five Forces: Bargaining power of suppliers
You're assessing the supplier landscape for Seneca Foods Corporation, and the picture is mixed: high fragmentation on the agricultural side, but significant external cost pressures on packaging inputs. Let's break down the power suppliers hold over Seneca Foods Corporation.
The bargaining power of raw material suppliers, primarily agricultural growers, is kept relatively low by scale and structure. Seneca Foods Corporation contracts with approximately 1,600 American growers for produce, fragmenting the supply base for its core vegetable inputs. This broad network inherently limits the leverage any single farm or small group of farms can exert on pricing or terms. Furthermore, Seneca Foods Corporation actively works to mitigate packaging supplier power through deep vertical integration. This includes owning seed breeding operations, which secures genetic stock, and manufacturing its own cans, which directly controls a major component cost.
Still, the inputs Seneca Foods Corporation cannot control internally are subject to extreme volatility. Raw material costs for produce, steel, and energy are highly volatile, driven by unpredictable weather patterns and global commodity markets. For instance, the gross margin as a percentage of net sales for the twelve months ended March 31, 2025, fell to 9.5% from 12.9% the prior year, reflecting these mounting cost pressures. Here's a quick look at the financial context surrounding these input costs for fiscal year 2025.
| Metric | Fiscal Year 2025 Value (12 Months Ended Mar 31, 2025) | Comparison Year Value (FY 2024) |
|---|---|---|
| Net Sales | $1,578.9 million | $1,458.6 million |
| Gross Margin (% of Net Sales) | 9.5% | 12.9% |
| Net Earnings | $41.2 million | $63.3 million |
The company's internal efforts to manage supply risk are evident in its operational scale. Seneca Foods Corporation manages over 8 million Sq. Ft. of warehousing and operates its own network of tractor trailers, helping to control logistics costs, which is another key input pressure point. The seed operations also provide a layer of control over the starting material quality and supply chain.
The external pressures, however, are significant and often outside the company's direct control. These pressures manifest in several ways:
- Rising costs for raw fruit and vegetables.
- Increased costs for steel, ingredients, and packaging.
- Impact of crude oil prices on distribution and energy.
- Labor shortages and labor inflation.
- Climate and weather affecting crop yields.
The power of packaging suppliers, particularly steel producers, has been amplified by trade policy. Steel tariffs increase costs for tin mill products, a key input for can manufacturing. A recent court ruling confirmed that Seneca Foods Corporation must pay Section 232 tariffs to import tin, with the levy being around 25% in that context. Furthermore, reports in late 2025 suggest a 50% tariff on imported steel is driving up canning costs generally, affecting roughly 80% of canned goods. This cost pressure is passed on; for example, the price of canned creamed corn from Seneca Foods Corporation was reported as 21.1% higher year-over-year in late 2025. Finance: draft 13-week cash view by Friday.
Seneca Foods Corporation (SENEB) - Porter's Five Forces: Bargaining power of customers
The bargaining power of customers for Seneca Foods Corporation is extremely high. You see this pressure reflected directly in the company's financial outcomes, as major buyers dictate terms in a market where product differentiation is often minimal.
This power stems from the concentration of sales to a few very large entities. Honestly, when you look at the structure, a massive portion of the business is exposed to these large buyers. Specifically, 87% of packaged food sales are under private label, foodservice, or contract packaging arrangements. This means that for nearly nine-tenths of its packaged food revenue, Seneca Foods is competing on price and service rather than on the strength of its own brand equity.
The switching costs for these customers between suppliers offering similar canned or private label products are quite low. If a major grocery chain decides to shift a portion of its private label green bean volume, moving to another processor is logistically straightforward, which keeps the heat on Seneca Foods' pricing.
This pricing pressure is not theoretical; it hits the bottom line. Pricing pressure from these major customers contributed directly to a gross margin decline to 9.5% in fiscal year 2025, which covers the twelve months ended March 31, 2025. That is a significant drop from the 12.9% margin seen in the prior fiscal year. The math is simple: higher costs from the challenging 2024 pack, combined with customer demands for lower prices, squeezed profitability hard.
To give you a clearer picture of the business Seneca Foods is conducting, here are some key financial and sales mix figures from the fiscal year 2025 results:
| Metric | Value (FY 2025) | Context |
|---|---|---|
| Net Sales | $1,578.9 million | Total revenue for the twelve months ended March 31, 2025. |
| Gross Margin Percentage | 9.5% | For the twelve months ended March 31, 2025. |
| Net Earnings | $41.2 million | Reported net earnings for fiscal year 2025. |
| Own Brand Sales Percentage | Approximately 13% | Packaged foods sold under Seneca Foods\' own or licensed brands. |
The customer base dictates the product focus, which you can see in the sales breakdown for fiscal year 2025:
- Canned vegetables accounted for 83% of total food packaging net sales.
- Private label, foodservice, and contract packaging represented 87% of packaged food sales.
- Frozen vegetables made up 8% of food packaging net sales.
- Fruit products comprised 6% of food packaging net sales.
The risk associated with this customer concentration was recently highlighted. Seneca Foods experienced sales disruptions from a key co-pack customer in the first quarter of fiscal 2026, which directly resulted in lower sales volumes for that period. While the company expects to recoup those volumes contractually, it underscores the volume risk inherent when a significant portion of your business relies on a few large partners.
Seneca Foods Corporation (SENEB) - Porter's Five Forces: Competitive rivalry
You're looking at the competitive landscape for Seneca Foods Corporation (SENEB), and honestly, the rivalry in the packaged fruit and vegetable space is a tough one. This industry is definitely mature, which usually means growth is harder to come by, forcing players to fight over existing market share.
The North America fruits & vegetables market size was valued at USD 115.62 billion in 2024, with a projected CAGR of 4.60% from 2025-2034. Even the more specific fruit and vegetable processing market, which is where Seneca sits, saw its size grow from $238.84 billion in 2024 to $255.85 billion in 2025, a CAGR of 7.1%. It's growth, sure, but it's not the explosive kind that lets everyone win easily. It's a battle for shelf space and customer dollars.
Seneca Foods Corporation is North America's leading provider, holding a large share in the retail private label market. This leadership position is crucial, but it also means they are the biggest target. They compete head-to-head with giants like Conagra Brands and The Kraft Heinz, along with other significant players in the packaged foods & meats industry.
Here's a look at some of the key rivals Seneca Foods faces in this crowded arena:
| Competitor | Industry Segment | Notes on Scale/Diversification |
|---|---|---|
| Conagra Brands | Packaged Foods | Large, diversified food company |
| The Kraft Heinz | Packaged Foods | Large, diversified food company |
| Dole | Packaged Fruits & Vegetables | Direct competitor |
| B&G Foods | Packaged Foods | Direct competitor |
| Kellanova (formerly Kellogg) | Snacks and Convenience Foods | Major food manufacturer |
| General Mills | Branded Consumer Foods | Major food manufacturer |
Competition is often based on price, which is reflected in the low 9.5% gross margin for Seneca Foods Corporation for the twelve months ended March 31, 2025. That margin is down significantly from 12.9% in the prior fiscal year. You see, when you're dealing with commodified products, passing on rising input costs-like those from the rainy growing season in 2024 or fluctuating tariffs-is tough because rivals will undercut you on price to win volume.
The pressure is evident in the financial results. For fiscal year 2025, Seneca Foods reported net sales of $1,578.9 million, but the lower gross margin shows that revenue growth didn't translate to proportional profit growth. The company itself noted that intense competition makes it hard to raise prices.
Seneca Foods Corporation's strong position in private label means they are a critical supplier to major retailers, but this segment is notoriously price-sensitive. Their success here relies on operational efficiency to maintain any margin at all. Consider their brand strength versus their private label focus:
- Holds a large share in the retail private label market.
- Owns highly regarded brands like Libby's®, Green Giant®, and Aunt Nellie's®.
- Aunt Nellie's® glass-packed vegetables hold 80% and 90% of the pickled beets and red cabbage categories, respectively.
- READ® canned vegetable salads dominate their specific categories.
The fact that Seneca Foods reduced net debt by $297 million year-over-year in fiscal 2025, despite the margin squeeze, shows strong operating cash flow, but it also suggests they are prioritizing balance sheet strength over margin expansion in this highly competitive environment. Finance: draft 13-week cash view by Friday.
Seneca Foods Corporation (SENEB) - Porter's Five Forces: Threat of substitutes
You're looking at the core vulnerability of Seneca Foods Corporation, which rests heavily on its primary product category. The threat of substitutes is substantial because consumers have numerous, often more appealing, alternatives for their vegetable and fruit consumption.
High threat from fresh and frozen produce, which consumers increasingly prefer for perceived health benefits. Data from 2023, which reflects ongoing trends into 2025, shows that while 38% of consumers typically bought canned vegetables, 72% bought fresh vegetables and 44% bought frozen vegetables. Furthermore, younger generations, like Gen Z and Millennials, are prioritizing non-GMO, organic, and sustainable options, which generally favor fresh or minimally processed foods. Fresh produce remains a cornerstone of health and wellness priorities, with fresh vegetables seeing a 1.2% year-over-year sales increase in 2024.
Alternative convenience foods like meal kits and prepared meals are gaining market share, directly competing for the consumer's dollar spent on quick meal solutions. The Prepared Meal Delivery Market was valued at $17.49 billion in 2025, growing at a Compound Annual Growth Rate (CAGR) of 32.68% from 2024. The broader Meal Kit Delivery Services Market was valued at $32.4 billion in 2025. This signals a strong consumer willingness to pay a premium for convenience over shelf-stable options.
Seneca's products, primarily canned vegetables, face an aging product category perception. For the fiscal year ending March 31, 2025, canned vegetables accounted for 83% of Seneca Foods Corporation's total food packaging net sales, totaling $1,314,315 thousand. This concentration in a category that consumers hypothetically desire less when price is not a constraint presents a clear strategic risk.
Low-cost, long-shelf-life canned goods maintain a competitive advantage for budget-conscious buyers, which is a key mitigating factor. Still, economic realities mean 32% of consumers report buying only what they can afford. However, pricing pressure is complex; as of late 2025, pricing for fresh, individually quick frozen (IQF), and canned vegetables is expected to be similar or slightly higher than frozen vegetables.
Here's a quick look at how the substitute markets compare in size as of 2025:
| Market Segment | 2025 Value/Share | Key Driver |
|---|---|---|
| Seneca Canned Vegetables (as % of Food Sales) | 83% | Shelf stability and established distribution |
| Meal Kit Delivery Services Market (Global) | $32.4 Billion | Demand for convenient home-cooked meals |
| Prepared Meal Delivery Market (Global) | $17.49 Billion | CAGR of 32.68% |
| North America Meal Kit Market Share | Over 45.9% | Fast-paced lifestyle and rising expenditure |
The consumer's trade-off between health and budget is central to this force. You see this in the data:
- 31% prefer healthy options when they can get a good deal.
- 21% buy healthy regardless of the price.
- 32% buy only what they can afford.
- 16% prefer healthy but find it too expensive to buy often.
If onboarding takes 14+ days, churn risk rises, which is analogous to how slow consumer adoption of a less-preferred format like canning can lead to market share erosion.
Finance: draft 13-week cash view by Friday.
Seneca Foods Corporation (SENEB) - Porter's Five Forces: Threat of new entrants
The threat of new entrants for Seneca Foods Corporation is generally low, primarily because the barriers to entry in the large-scale, vertically integrated canned and frozen vegetable processing industry are substantial. A new competitor would face immediate hurdles related to capital, established infrastructure, and market access.
Low threat due to significant capital investment required for processing facilities and logistics.
Starting a competing operation requires massive upfront capital expenditure. Seneca Foods Corporation, a market leader, reported net sales of $1,578.9 million in fiscal year 2025, illustrating the scale required to compete effectively. Building state-of-the-art processing facilities capable of handling the volume necessary to achieve cost parity is a multi-million dollar undertaking. Furthermore, logistics require significant investment; Seneca Foods manages over 8 million Sq. Ft. of warehousing and maintains its own network of tractor trailers to support its operations. A new entrant would need to replicate this physical footprint or pay premium rates to third-party logistics providers, immediately eroding potential margins.
Seneca's vertical integration creates a massive cost advantage for new entrants.
Seneca Foods Corporation's deep vertical integration acts as a significant structural barrier. This integration spans from the genetic level to the final packaging. For instance, Seneca manages its own seed operations, including conditioning, treating, packaging, and storage for core vegetable seed varieties. They also manufacture billions of cans annually at facilities in Wisconsin and Idaho, which streamlines the supply chain. A new entrant would have to establish these complex, capital-intensive operations from scratch, whereas Seneca benefits from years of optimized, integrated processes. The scale of their raw material sourcing further compounds this advantage, as they contract with well over 1,600 American vegetable farms for over 200,000 acres of produce.
The key components of Seneca Foods Corporation's integrated structure that deter new entrants include:
- Seed operations for sweet corn, beans, peas, carrots, onions, and beets.
- In-house steel can manufacturing for supply chain control.
- Direct contracting with over 1,600 growers.
- Management of over 8 million Sq. Ft. of warehousing space.
Difficulty in replicating Seneca's established distribution to almost every US retailer and 55+ export countries.
Securing shelf space and reliable international routes is a monumental task. Seneca Foods Corporation supplies products to almost every major U.S. retailer, covering supermarkets, mass merchandisers, club stores, and dollar stores. This established presence is not easily bought. On the international front, Seneca's products reach approximately 55 countries. Building the necessary logistics, regulatory compliance, and retailer relationships across this many jurisdictions presents a time-consuming and capital-intensive challenge that new entrants are unlikely to overcome quickly.
The established market footprint of Seneca Foods Corporation as of fiscal 2025 can be summarized as follows:
| Market Segment | Metric/Reach |
|---|---|
| Domestic Retailers | Almost every major US retailer |
| International Export | Approximately 55 countries |
| Farm Sourcing | Contracting with well over 1,600 American farms |
| Warehousing Footprint | Over 8 million Sq. Ft. managed |
Stringent food safety regulations and established brand loyalty act as barriers.
The food processing sector is heavily regulated by bodies like the FDA and USDA, requiring adherence to Current Good Manufacturing Practices (cGMP) and extensive traceability systems. A new entrant must navigate these complex, non-negotiable compliance requirements, which demand specialized personnel and ongoing investment in quality assurance systems. Furthermore, Seneca benefits from established consumer trust associated with its owned and licensed brands. Approximately 13% of Seneca Foods Corporation's packaged foods were sold under its own brands or licensed trademarks, including Libby's® and the Green Giant® shelf-stable license. Overcoming this level of established brand loyalty, which often translates into preferred vendor status with retailers, is a major hurdle for any newcomer.
Disclaimer
All information, articles, and product details provided on this website are for general informational and educational purposes only. We do not claim any ownership over, nor do we intend to infringe upon, any trademarks, copyrights, logos, brand names, or other intellectual property mentioned or depicted on this site. Such intellectual property remains the property of its respective owners, and any references here are made solely for identification or informational purposes, without implying any affiliation, endorsement, or partnership.
We make no representations or warranties, express or implied, regarding the accuracy, completeness, or suitability of any content or products presented. Nothing on this website should be construed as legal, tax, investment, financial, medical, or other professional advice. In addition, no part of this site—including articles or product references—constitutes a solicitation, recommendation, endorsement, advertisement, or offer to buy or sell any securities, franchises, or other financial instruments, particularly in jurisdictions where such activity would be unlawful.
All content is of a general nature and may not address the specific circumstances of any individual or entity. It is not a substitute for professional advice or services. Any actions you take based on the information provided here are strictly at your own risk. You accept full responsibility for any decisions or outcomes arising from your use of this website and agree to release us from any liability in connection with your use of, or reliance upon, the content or products found herein.