
|
Seneca Foods Corporation (SENEB): BCG Matrix [Dec-2025 Updated] |
Fully Editable: Tailor To Your Needs In Excel Or Sheets
Professional Design: Trusted, Industry-Standard Templates
Investor-Approved Valuation Models
MAC/PC Compatible, Fully Unlocked
No Expertise Is Needed; Easy To Follow
Seneca Foods Corporation (SENEB) Bundle
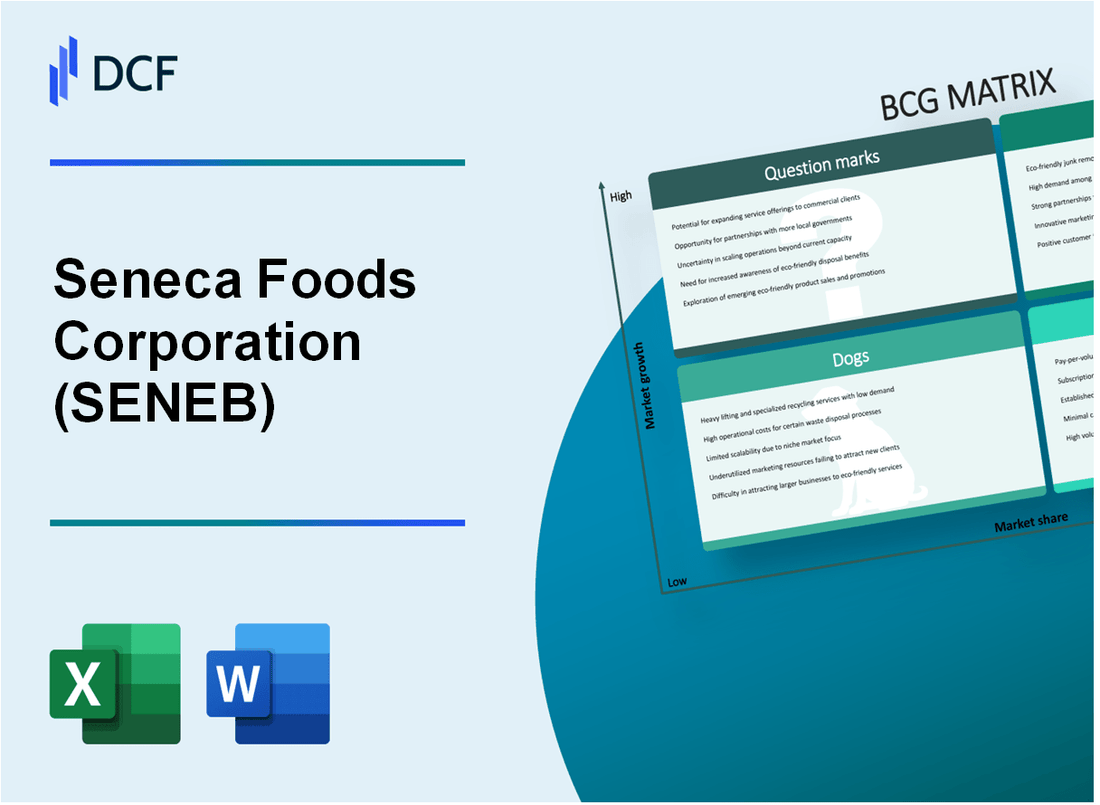
You're looking to map out where Seneca Foods Corporation (SENEB) is placing its bets as we hit late 2025, and honestly, the picture is exactly what you'd expect from a major food processor: a solid base of Cash Cows funding the fight for future growth. We see strong, high-share brands acting as Stars-like those Libby's value-added lines-while legacy canned fruit products are clearly stuck in the Dogs quadrant, draining focus. The real question, the one that dictates capital allocation for the next few years, lies in those emerging Question Marks, like new packaging formats or small acquisitions. Let's break down exactly where your capital should be focused across these four zones below.
Background of Seneca Foods Corporation (SENEB)
You're looking to map out where Seneca Foods Corporation (SENEB) stands strategically as of late 2025. To do that right, we first need a clear picture of the company's scale and what it actually sells. Seneca Foods is a major player in North America, focusing on processing and packaging fruits and vegetables, sourcing from over 1,100 American farms.
The company's revenue streams are quite diverse, though heavily weighted toward packaged foods, which account for more than 95% of its sales. They operate across several key product categories: canned produce, frozen produce, bottled produce, and snack chips. Seneca Foods serves a wide customer base, distributing to about 55 countries, hitting retail outlets, food service distributors, and international markets.
When we look at the top-line numbers for the fiscal year ending March 31, 2025, Seneca Foods posted net sales of $1,578.9 million, which was a nice jump from the prior year's $1,458.6 million. That growth came from higher sales volumes and better pricing. However, the overall gross margin for that full fiscal year was tight at just 9.5%, down from 12.9% the year before, largely due to the high cost of the 2024 pack influenced by poor weather.
Still, the most recent data shows some margin recovery. For the six months ending September 27, 2025, net sales reached $757.5 million, and the gross margin percentage improved to 13.7% compared to 11.7% in the same period last year. Management noted that the 2025 harvest was closer to budget, helping normalize costs, though they were still working through some of that expensive 2024 inventory.
We know Seneca Foods markets products under its own labels, like Libby's®, Aunt Nellie's®, and CherryMan®, but a significant portion of the business involves contract packing. For instance, they pack select Green Giant® frozen vegetables and shelf-stable Green Giant® and Le Sueur® brands for B&G Foods North America. Historically, we've seen segment performance vary; for example, in one recent quarter, canned vegetables revenue was up 6.9%, but frozen vegetables revenue was down 9.2%.
The company also has some non-core activities, including the sale of cans and ends, plus trucking and aircraft operations, but these are secondary to the packaged food business. Seneca Foods has been actively managing its balance sheet, reporting a $297 million reduction in net debt year-over-year as of March 31, 2025. That's a concrete action showing focus on financial health.
Seneca Foods Corporation (SENEB) - BCG Matrix: Stars
The business units or products with the best market share and generating the most cash are considered Stars. Seneca Foods Corporation is the largest processor of canned vegetables in the U.S..
Branded value-added frozen vegetables are a focus area, though frozen vegetables represented 8% of total food packaging net sales in fiscal year 2025, totaling $124,714 thousand. The overall unit volumes for Seneca Foods Corporation in the second quarter ended September 27, 2025, were up 10.2% year-over-year, indicating strong demand in core areas.
The largest segment, Canned vegetables, represented 83% of the Company's total food packaging net sales in fiscal year 2025. Net sales for Canned vegetables in fiscal year 2025 totaled $1,314,315 thousand. The overall canned vegetable market size is expected to grow from $23.06 billion in 2024 to $24.21 billion in 2025, a compound annual growth rate of 5% for the historic period.
The company's products are sold under highly regarded brands including Libby's® and Green Giant®. The Green Giant U.S. shelf-stable business was acquired in September 2023. Approximately 13% of Seneca Foods Corporation's packaged foods were sold under its own brands or licensed trademarks.
| Product Category | Net Sales (FY2025, in thousands) | Percentage of Total Food Packaging Net Sales (FY2025) |
| Canned vegetables | $1,314,315 | 83% |
| Frozen vegetables | $124,714 | 8% |
| Fruit products | $92,378 | 6% |
| Snack products | $14,995 | 1% |
Segments showing strong growth, outpacing the overall canned market, are those where unit volumes are increasing, such as the 10.2% unit volume increase reported for the quarter ended September 27, 2025.
- Net sales for the twelve months ended March 31, 2025, totaled $1,578.9 million.
- Net sales for the second quarter ended September 27, 2025, were $460.0 million, an increase of 8.1% year-over-year.
- The company's private label share accounts for almost 23% of volume, at record highs.
- Libby's® is listed among the highly regarded brands.
Seneca Foods Corporation (SENEB) - BCG Matrix: Cash Cows
The Cash Cow quadrant for Seneca Foods Corporation is anchored by its dominant position in mature, slow-growth segments, primarily core canned vegetables and private label/contract packing services. These units generate more cash than is required to maintain their market share.
Private label and contract packing services for major national retailers represent a significant portion of Seneca Foods Corporation's stable volume and revenue base. In fiscal year 2024, approximately $\text{89%$ of Seneca Foods Corporation's packaged foods were sold under other channels, which includes private labels, food service, and contract packing. More recently, the trend shows customers preferring private labels, with that share reaching almost $\text{23%$ of volume. The overall canned vegetable market size is projected to grow modestly, from $\text{$23.06 billion$ in 2024 to $\text{$24.21 billion$ in 2025, representing a $\text{5%$ growth rate.
Core canned vegetable categories, such as corn, peas, and beans, are where Seneca Foods Corporation holds a dominant, high-share position, making them classic Cash Cows. For the twelve months ended March 31, 2024, Canned vegetables generated net sales of $\text{$1,204.8 million$, which was $\text{83%$ of the total food packaging net sales. While overall net sales for the twelve months ended March 31, 2025, reached $\text{$1,578.9 million$, this high-volume business consistently generates significant free cash flow, which is the primary characteristic of a Cash Cow.
The financial performance clearly illustrates the cash generation capability. For the twelve months ended March 31, 2025, Seneca Foods Corporation reported Free Cash Flow of $\text{$298.3 million$, a substantial turnaround from the $-\text{$119.6 million$ reported for the prior period ending March 2024. This metric moved by $+\text{$417.9 million$ year-over-year, or $+\text{349.4%$. Investments here are focused on maintaining infrastructure efficiency rather than aggressive market expansion.
Here are key financial metrics for the full fiscal years ending March 31:
| Metric | Fiscal Year 2024 | Fiscal Year 2025 |
| Net Sales (Total) | $\text{$1,458.6 million$ | $\text{$1,578.9 million$ |
| Gross Margin Percentage | $\text{12.9%$ | $\text{9.5%$ |
| Free Cash Flow | $-\text{$119.6 million$ | $\text{$298.3 million$ |
The Cash Cow segment supports the entire corporation through its reliable cash generation. Key attributes supporting this classification include:
- Core canned vegetable sales represented $\text{83%$ of food packaging net sales in fiscal year 2024.
- The majority of packaged foods, $\text{89%$ in fiscal year 2024, are sold through private label and contract channels.
- Free Cash Flow for the period ending March 2025 was $\text{$298.3 million$.
- The market for canned vegetables is mature, with projected growth of $\text{5%$ from 2024 to 2025.
- Consumption trends show retreat in peas and chickpeas, but growth in beans, indicating segment maturity.
- Unit volumes for the second quarter of fiscal 2026 (ending September 27, 2025) were up $\text{10.2%$ year-over-year.
- Net sales for the second quarter of fiscal 2026 (ending September 27, 2025) were up $\text{8.1%$ year-over-year.
The high-volume nature of this business, despite often being low-margin, results in substantial cash flow when managed efficiently. For instance, the second quarter of fiscal 2026 saw net sales of $\text{$425.5 million$ in the prior year period (Q2 FY2025), with gross margin at $\text{10.1%$.
Seneca Foods Corporation (SENEB) - BCG Matrix: Dogs
Units categorized as Dogs for Seneca Foods Corporation operate in markets characterized by minimal expansion or outright contraction, coupled with a relatively small footprint within the company's overall revenue base. These are the product lines or facilities that require management attention to prevent them from becoming cash drains, even if they currently break even.
The primary candidates for this quadrant relate to specific, legacy product groups where volume has been demonstrably declining, such as the older legacy canned fruit products. These lines face sustained, multi-year volume declines, which is a classic indicator of a Dog position, despite overall company growth in other areas.
Consider the historical trend for the Fruit products category, which represents a small fraction of the total food packaging net sales. This segment's performance suggests a low-growth or negative-growth profile when compared to the dominant Canned vegetables segment.
| Metric | Fiscal Year 2024 Net Sales (in thousands) | Fiscal Year 2023 Net Sales (in thousands) | Year-over-Year Change |
|---|---|---|---|
| Fruit products | $87,435 | $91,495 | -$4,060 |
| Canned vegetables | $1,204,823 | $1,253,257 | -$48,434 |
The table above shows that the Fruit products category experienced a net sales decline of $4,060 thousand between fiscal year 2023 and fiscal year 2024. While the overall Vegetable segment also saw a decline, the Fruit products category is significantly smaller, making its decline more indicative of a low-share, low-growth unit. For the second quarter ending September 27, 2025, the combined Fruit and Snack Segment reported net sales of $27.8 million, which remains a small portion of the total quarterly revenue of $460.0 million.
Older, less-efficient processing facilities often become tied to these declining product lines. While Seneca Foods Corporation stated an aggressive production plan for 2025 with facilities running at capacity overall, the imperative to explore opportunities to utilize existing capacity suggests specific, older assets may be underutilized or operating at suboptimal efficiency, particularly those dedicated to these lower-volume categories.
The financial environment itself pressures these units. For the twelve months ending March 31, 2025, the company's gross margin percentage declined to 9.5% from 12.9% the prior year, signaling cost pressures that make turning around low-margin Dogs particularly expensive. The LIFO accounting methodology further impacted reported earnings; for fiscal year 2025, this represented a non-cash charge to earnings before income taxes of $34.5 million.
The profile of these Dog units can be summarized by their characteristics:
- Legacy canned fruit products facing sustained, multi-year volume declines.
- Specific regional or niche branded products with low market share.
- Older, less-efficient processing facilities tied to declining product lines.
- Any product category where both market share and industry growth are in the low single digits or negative.
The core issue is that these units frequently break even, tying up capital that could be better deployed in Stars or Question Marks. The company's overall net sales for the twelve months ending March 31, 2025, were $1,578.9 million, making the small, declining fruit lines a prime candidate for divestiture if turnaround costs exceed potential recovery.
Seneca Foods Corporation (SENEB) - BCG Matrix: Question Marks
You're hiring before product-market fit, and that's where Question Marks live-high potential, high cash burn. For Seneca Foods Corporation, identifying these specific units requires looking at areas where growth is happening but market share isn't yet dominant, or where new ventures are consuming capital.
Recent, smaller acquisitions or joint ventures in emerging food categories
The most recent acquisition detailed in the available records was for the Green Giant shelf-stable vegetable product line from B&G Foods, executed on November 8, 2023. As of September 2025 data, no acquisitions were completed in the current calendar year. The company has made a total of 4 acquisitions historically, with the most recent being Paradise in April 2019.
New branded product launches aiming for premium pricing in a crowded market
Seneca Foods Corporation maintains a large market share in the retail private label, food service, restaurant chains, international, contracting packaging, industrial, chips, and cherry products segments. The company's products are sold under brands including Libby's, Aunt Nellie's, Cherryman, Green Valley, READ, and Seneca. In the six months ended September 27, 2025, net sales totaled $757.5 million, with a gross margin as a percentage of net sales of 13.7%.
| Product Category (FY2025) | Share of Food Operations Sales | Net Sales (FY2025 Q4) | Gross Margin (FY2025 Q4) |
| Canned vegetables | 83% | $304.7 million (Q1) | $42.7 million (Q1) |
| Frozen vegetables | 8% | $425.5 million (Q2) | $42.9 million (Q2) |
| Fruit products | Remaining Percentage | $502.9 million (Q3) | $49.1 million (Q3) |
International expansion efforts into new, unproven geographic markets
The distribution network for Seneca Foods Corporation's products spans approximately 55 countries as of the fiscal year end March 31, 2025. The net sales for the twelve months ended March 31, 2025, reached $1,578.9 million, an increase of $120.3 million year-over-year, driven by higher sales volumes and increased selling prices.
- Total countries of distribution: 55
- FY2025 Net Sales: $1,578.9 million
- FY2025 Gross Margin Percentage: 9.5%
- Employees as of 2025: 6,895
Small-scale investment in new packaging formats (e.g., pouches) that require high initial capital but have an uncertain market reception
While the company is vertically integrated and focuses on packaged foods, specific financial disclosures regarding high initial capital expenditure for new packaging formats like pouches in 2025 were not explicitly detailed in the latest reports. However, the overall gross margin pressure suggests high costs associated with production or inventory. For the quarter ending September 27, 2025, the gross margin as a percentage of net sales was 13.4%, up from 10.1% for the same period in the prior year.
The company reduced its net debt by $297 million year-over-year as of March 31, 2025, which points to cash being directed toward balance sheet improvement rather than necessarily high-risk, unproven product/format investments.
Disclaimer
All information, articles, and product details provided on this website are for general informational and educational purposes only. We do not claim any ownership over, nor do we intend to infringe upon, any trademarks, copyrights, logos, brand names, or other intellectual property mentioned or depicted on this site. Such intellectual property remains the property of its respective owners, and any references here are made solely for identification or informational purposes, without implying any affiliation, endorsement, or partnership.
We make no representations or warranties, express or implied, regarding the accuracy, completeness, or suitability of any content or products presented. Nothing on this website should be construed as legal, tax, investment, financial, medical, or other professional advice. In addition, no part of this site—including articles or product references—constitutes a solicitation, recommendation, endorsement, advertisement, or offer to buy or sell any securities, franchises, or other financial instruments, particularly in jurisdictions where such activity would be unlawful.
All content is of a general nature and may not address the specific circumstances of any individual or entity. It is not a substitute for professional advice or services. Any actions you take based on the information provided here are strictly at your own risk. You accept full responsibility for any decisions or outcomes arising from your use of this website and agree to release us from any liability in connection with your use of, or reliance upon, the content or products found herein.