
|
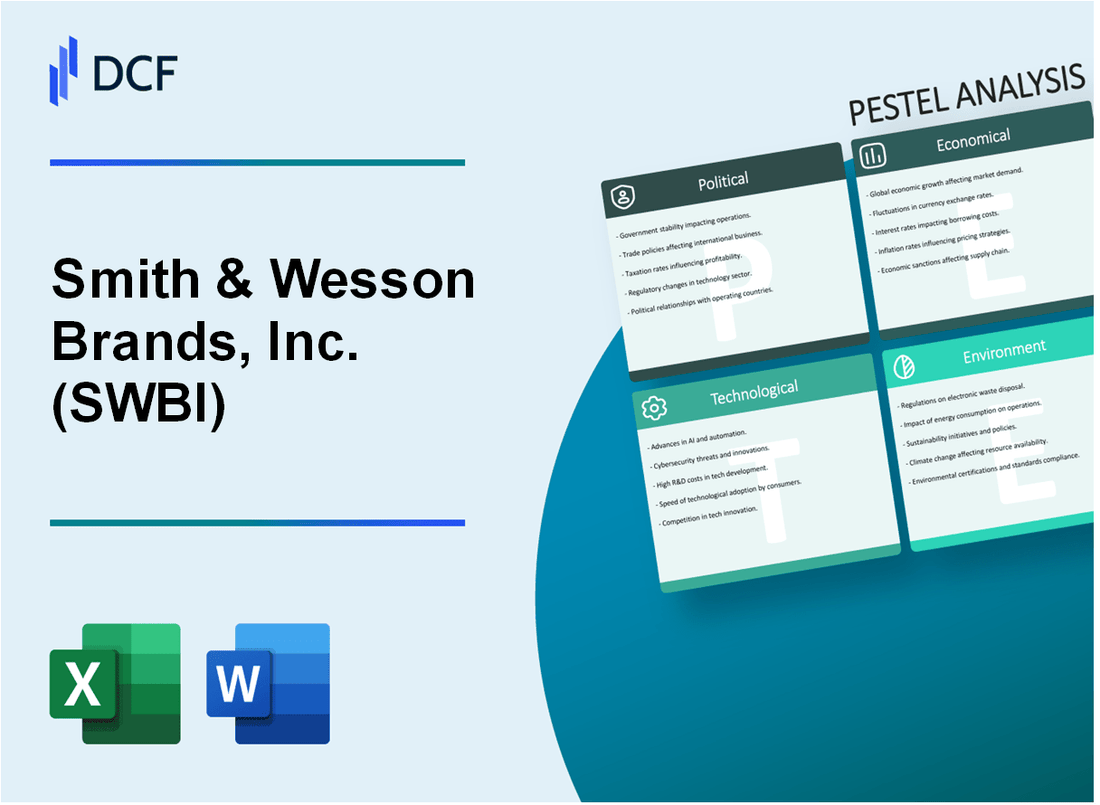
Smith & Wesson Brands, Inc. (SWBI): PESTLE Analysis [Nov-2025 Updated] |
Fully Editable: Tailor To Your Needs In Excel Or Sheets
Professional Design: Trusted, Industry-Standard Templates
Investor-Approved Valuation Models
MAC/PC Compatible, Fully Unlocked
No Expertise Is Needed; Easy To Follow
Smith & Wesson Brands, Inc. (SWBI) Bundle
You're looking for a clear map of Smith & Wesson Brands, Inc. (SWBI) risks and opportunities, and honestly, it all comes down to six key areas. The company operates at the sharp intersection of politics, law, and consumer sentiment, so understanding the PESTLE framework (Political, Economic, Sociological, Technological, Legal, and Environmental factors) is defintely your best move for making informed decisions. For FY2025, analysts project revenue around $650 million, but that number is vulnerable to everything from a new federal court ruling on the Second Amendment to the next wave of polymer frame technology. You can't just look at the balance sheet; you have to map the external forces to anticipate the real risks and opportunities.
Smith & Wesson Brands, Inc. (SWBI) - PESTLE Analysis: Political factors
You're looking at Smith & Wesson Brands, Inc. (SWBI) and trying to map the political landscape, which, frankly, is always a high-wire act for the firearms industry. The direct takeaway for fiscal year 2025 is a complex duality: federal deregulation is providing a tailwind, but a surge in state-level restrictions is creating significant market fragmentation and sales pressure. The political environment is defintely a mixed bag right now.
Shifting federal and state gun control legislation creates market volatility.
The firearms market is highly sensitive to legislative cycles, and 2025 has been no exception, leading to a volatile environment for Smith & Wesson Brands. While the federal government has moved toward deregulation, state legislatures are pushing in the opposite direction, creating a patchwork of compliance headaches.
On the federal side, a major pro-industry change is coming: H.R. 1, signed in July 2025, is set to eliminate the $200 National Firearms Act (NFA) tax stamp for suppressors, short-barreled rifles, and short-barreled shotguns starting January 1, 2026. That's a clear incentive for a segment of the market where Smith & Wesson Brands' Gemtech brand operates.
But here's the rub: state-level restrictions are accelerating. Following the U.S. Supreme Court's refusal in June 2025 to hear a challenge to D.C.'s high-capacity magazine ban, the regulatory stability for states to enact their own laws is cemented. This forces Smith & Wesson Brands to produce state-compliant versions, which adds cost and complexity. Right now, 14 states and the District of Columbia have magazine capacity limits, and Connecticut became the 10th state since 2021 to pass laws expanding civil lawsuits against firearm manufacturers for illegal conduct. This is a major liability risk.
The financial impact of this regulatory uncertainty, combined with macro-economic headwinds, was clear in the company's full-year fiscal 2025 results:
| Metric (Fiscal Year 2025) | Value | Context |
|---|---|---|
| Full-Year Net Sales | $474.7 million | Down 11.4% from FY2024. |
| Handgun Revenue | $331.9 million | Down from $381.9 million in FY2024. |
| Long Gun Revenue | $104 million | Down from $116.5 million in FY2024. |
Executive branch policy changes impact ATF enforcement and import/export rules.
The executive branch, acting through the Bureau of Alcohol, Tobacco, Firearms and Explosives (ATF), has provided a significant easing of regulatory enforcement. This shift is a direct benefit to Smith & Wesson Brands and its network of Federal Firearms Licensees (FFLs).
The ATF repealed its 'Enhanced Regulatory Enforcement Policy' (the so-called Zero Tolerance Policy) in April 2025. This new framework prioritizes serious or willful violations, moving away from mandating revocation for minor paperwork errors. This reduces the operational risk for the company's vast distribution network.
Also, the ATF provided clarity on international trade, which is crucial for the company's professional and global markets. They introduced rulings in 2025 that:
- Allow certain dual-use barrels for import (Ruling 2025-1).
- Expand training ammunition import approvals (Ruling 2025-2).
These changes streamline compliance and make the supply chain for certain components more predictable.
Pro-Second Amendment lobbying efforts stabilize regulatory risk in key states.
The industry's lobbying power remains a critical political stabilizer, particularly at the federal level where it has been highly effective in 2025. The collective spending of pro-gun groups is substantial, dwarfing the expenditure of gun-control advocates.
In the first quarter of 2025 alone, the National Shooting Sports Foundation (NSSF), which is the industry's trade group, spent $1.85 million on federal lobbying. Other pro-gun groups added an additional $1.28 million in Q1 2025. This heavy spending helps push for favorable federal legislation and block restrictive proposals.
Smith & Wesson Brands also engages directly, spending $40,000 in Q1 2025 to lobby on key issues like the Arms Export Control Act and, importantly, against financial institutions that 'discriminate' against firearms manufacturers. This direct action aims to keep capital and banking services accessible.
Government contract opportunities offer a stable revenue stream for military/police sales.
While consumer demand is cyclical and politically charged, the professional market-military and law enforcement sales-offers a crucial, stable revenue base. Smith & Wesson Brands actively leverages this channel to mitigate the volatility of the consumer market.
The company's strategy to increase demand in law enforcement and military channels is a smart hedge against consumer market softness. In the fiscal year 2024, the institutional sales segment saw a notable 12% revenue jump, helping to stabilize cash flows. The company continues to focus on these channels, which, while not providing the massive spikes of a political-scare-driven consumer rush, provide consistent, high-margin revenue streams from federal and local contracts for pistols, rifles, and related accessories.
Finance: draft 13-week cash view by Friday, incorporating the new state-level compliance costs and the H.R. 1 upside. That's the next step.
Smith & Wesson Brands, Inc. (SWBI) - PESTLE Analysis: Economic factors
Inflation and high interest rates pressure consumer discretionary spending on firearms.
The current macroeconomic environment, marked by persistent inflation and elevated interest rates, is a significant headwind for Smith & Wesson Brands, Inc. You see this play out directly in consumer discretionary spending (money left over after essentials). A firearm purchase is a major outlay, so when the Federal Reserve keeps rates high to cool the economy, it makes financing more expensive and forces consumers to prioritize groceries and rent over a new pistol.
This pressure is evident in the company's fiscal year 2025 results. Full-year net sales for FY2025 (ended April 30, 2025) were reported at $474.7 million, a decrease of 11.4% from the prior fiscal year. That's a drop of $61.2 million in sales, which is a tough pill to swallow. Here's the quick math: a higher cost of living means less disposable income, so fewer people are buying non-essential durable goods like guns.
The impact is also visible in quarterly performance:
- Q3 FY2025 Net Sales: $115.9 million, a 15.7% year-over-year decrease.
- Q4 FY2025 Net Sales: $140.8 million, an 11.6% year-over-year decrease.
Economic downturns historically correlate with increased first-time gun ownership sales.
To be fair, the firearms market is unique; it doesn't always follow the typical discretionary cycle. Historically, periods of high social or political uncertainty-which often coincide with economic stress-drive a surge in first-time gun ownership. Fear defintely sells guns. The 2020-2021 period saw record sales fueled by the pandemic, social unrest, and political volatility, with total estimated U.S. firearm sales peaking at around 21.8 million in 2020.
However, the current economic slowdown is different. The market is now experiencing a 'post-boom contraction,' with estimated total U.S. gun sales declining to about 16.1 million in 2024, and projected to drop further to roughly 15.5 million in 2025. This is an environment of economic drag without the political panic that typically triggers a massive influx of first-time buyers. The current environment is a grind, not a boom.
Strong U.S. dollar makes international sales less competitive on price.
The strength of the U.S. dollar (USD) in 2025 presents a clear challenge to Smith & Wesson Brands' international sales. When the dollar is strong, American-made products become more expensive for foreign buyers using weaker local currencies. For a company like Smith & Wesson that exports its products, this directly impacts their price competitiveness in global markets.
As the U.S. economy has shown relative resilience, the USD has remained strong against many major currencies, entering 2025 at a multi-year high. A strong dollar means foreign customers need to spend more of their local currency to buy the same Smith & Wesson firearm, which can lead to lower sales volume or pressure on the company to cut prices and sacrifice margin to compete with local manufacturers. A strong dollar is great for U.S. importers, but it hurts U.S. exporters.
Analyst consensus projects Smith & Wesson's FY2025 revenue around $650 million.
While the actual reported Net Sales for the full fiscal year 2025 (ended April 30, 2025) were $474.7 million, the market's initial sentiment and high-end estimates had been more optimistic, reflecting the volatility in the firearms sector. The reported revenue of $474.7 million was a miss against some earlier, higher analyst expectations, demonstrating the difficulty in forecasting this politically and economically sensitive industry.
The table below summarizes the key financial metrics for the most recent fiscal year:
| Metric | FY2025 (Ended April 30, 2025) | Year-over-Year Change |
|---|---|---|
| Net Sales | $474.7 million | Down 11.4% |
| Net Income | $13.4 million | Down 67.6% |
| Diluted EPS (GAAP) | $0.30 per share | Down 65.2% |
| Gross Margin | 26.8% | Down from 29.5% in FY2024 |
Finance: Monitor the DXY (Dollar Index) for any sustained weakening, as a lower dollar could provide a much-needed tailwind for international sales volume in the back half of FY2026.
Smith & Wesson Brands, Inc. (SWBI) - PESTLE Analysis: Social factors
The social environment for Smith & Wesson Brands, Inc. (SWBI) is a study in contrasting forces, with demand fueled by personal security concerns and demographic shifts, but simultaneously constrained by intense brand polarization and scrutiny over corporate responsibility (CSR). You need to understand that this polarization isn't just a political issue; it directly impacts their ability to maintain a stable market and attract a diverse customer base.
Public safety concerns drive demand for personal protection and concealed carry permits.
Rising public concern over crime and personal security is the single largest driver for Smith & Wesson Brands, Inc.'s core handgun business. This is why handguns are the most common firearm used for self-defense, accounting for 65.99% of defensive incidents. The demand for concealed carry permits (CCW) remains high, even as 29 states have adopted Constitutional Carry (permitless carry) laws, which means the permit count of 21.46 million permit holders as of December 2024 is defintely an undercount of the total number of Americans carrying a concealed firearm.
The 2020 surge in permit applications is creating a renewal wave in 2025, which keeps the focus on personal defense products like the M&P (Military & Police) series. A 2024 Pew Research Center poll confirmed that 72% of gun owners cite personal protection as their primary reason for owning a firearm. That's the core market.
Increased participation in shooting sports and hunting supports long-term demand.
Beyond self-defense, the recreational market provides a crucial, less volatile revenue stream. Over 47 million U.S. residents participate in firearm target shooting, which is a massive base for Smith & Wesson Brands, Inc.'s rifles and performance pistols. The global sports gun market is projected to grow from $2.46 billion in 2024 to $2.62 billion in 2025, showing a healthy 6.2% Compound Annual Growth Rate (CAGR) driven by increased participation.
Smith & Wesson Brands, Inc. is actively targeting this segment with new products like the Model 1854 lever-action rifle, which caters to the traditional hunting and modern lever-gun enthusiast. This segment is less sensitive to political cycles, so it provides stability.
Demographic shifts show growing interest in gun ownership among women and minorities.
The fastest-growing segments of the gun-owning population are women and minority groups, a significant shift from the traditional demographic base. This trend creates a clear opportunity for Smith & Wesson Brands, Inc. to expand its market share by focusing on smaller, more easily concealable handguns.
Here's the quick math on this demographic shift:
| Demographic Group | Ownership Trend | Key Statistic (2017-2023/2024) |
|---|---|---|
| Women | Significant increase | Ownership up 177.8% since 1993; 22% of women own a gun (up from 18% in 2017). |
| Hispanics | Fastest-growing demographic | 33% increase in ownership between 2017 and 2023. |
| Black Adults | Major increase | Ownership has nearly doubled since 2017. |
Women also accounted for 29.1% of CCW permit holders in the states that provide gender data in 2024, indicating a strong focus on self-defense in this growing segment.
Brand image is highly polarized, affecting corporate social responsibility (CSR) initiatives.
Smith & Wesson Brands, Inc.'s brand image is inherently polarized by the national debate on firearms, which forces a unique CSR strategy. The company's Corporate Stewardship Policy, updated in September 2024, explicitly states a dual role: to be a steward of the iconic brand and to protect the Second Amendment rights of its customers.
Their CSR efforts focus on responsible use and safety, which is a direct countermeasure to the negative public perception and the threat of increased regulation. This is a defensive CSR strategy, not a purely philanthropic one. The company's CSR efforts include:
- Sponsoring industry-wide initiatives like Project ChildSafe and FixNICS.
- Running the GUNSMARTS program, a free video series on YouTube to educate new gun owners on safety, storage, and shooting fundamentals.
- Maintaining a high-quality reputation, which allows them to sustain a Gross Margin of 26.8% for the full fiscal year 2025, despite an 11.4% decline in net sales to $474.7 million.
The polarization is a constant financial risk, as demonstrated by the shareholder resolution in 2023 requesting an independent third-party Human Rights Impact Assessment to address the human rights impacts of its products. This is a clear signal that the polarization translates into direct pressure from investors and activists.
Smith & Wesson Brands, Inc. (SWBI) - PESTLE Analysis: Technological factors
You're looking at Smith & Wesson Brands, Inc.'s (SWBI) technology landscape, and the story is about smart manufacturing efficiency and a cautious, almost resistant, stance on disruptive product tech. The company is defintely prioritizing internal production gains and a growing digital storefront over chasing the high-risk, high-liability 'smart gun' trend.
Investment in polymer frame technology reduces manufacturing costs and weight.
Smith & Wesson's long-term investment in polymer frame technology remains a core competitive advantage, especially within the handgun segment, which accounted for a massive $331.9 million of the company's total Net Sales of $474.7 million in fiscal year 2025. This isn't just about making lighter guns; it's about controlling the cost and speed of production.
The company vertically integrated its precision plastic molding years ago, which essentially cuts out a key middleman and insulates its supply chain from external shocks. This capability is a cornerstone of their flexible manufacturing model, allowing them to quickly adjust production volume for popular polymer-frame products like the M&P (Military & Police) line. Here's the quick math on the product mix:
- Handgun Sales (FY2025): $331.9 million
- Long Gun Sales (FY2025): $104.0 million
- Total Handguns Shipped (FY2025): 798,000 units
The material choice directly translates to lower material cost compared to all-metal frames, plus it speeds up assembly. That's a huge factor in maintaining their Gross Profit of $127.2 million, even as overall Net Sales declined 11.4% in FY2025. It's a proven, high-volume technology.
Smart gun (personalized firearm) technology is a looming regulatory and product development factor.
The biggest technological risk and opportunity Smith & Wesson is actively avoiding is the personalized firearm, or smart gun, technology. The company's long-standing position is one of firm opposition, citing reliability concerns and a lack of consumer demand. Honestly, they see it as a liability nightmare.
While other companies are making advancements in biometric (fingerprint) and radio-frequency identification (RFID) authentication systems in 2025, Smith & Wesson has publicly stated they are a manufacturing company, not a technology company, and are poorly suited to develop such high-risk electronics. This stance creates a critical long-term vulnerability: if a state or federal mandate were to pass requiring personalized firearms-a non-zero political risk-the company would be caught flat-footed, facing a massive, sudden R&D push or a loss of market share. For now, they are betting that consumer resistance to an unreliable, expensive, and complex firearm will continue to outweigh regulatory pressure.
Computer Numerical Control (CNC) machining advances improve production efficiency and precision.
The real technology story at Smith & Wesson is on the factory floor, where Computer Numerical Control (CNC) machining is the backbone of precision. Advances in CNC, including the industry trend toward 5-axis machining and integrating Artificial Intelligence (AI) for predictive maintenance, are crucial for producing high-tolerance metal components for their revolvers and the M&P Metal series.
The company's ability to quickly shift production between models-its 'flexible manufacturing model'-relies entirely on modern CNC equipment. This flexibility is what allows them to introduce new, high-precision products like the M&P Metal Compact and the Performance Center Carry Comp models, which represented a significant 44% of sales in the second quarter of fiscal 2025. They are investing in this: Capital Expenditures for fiscal 2025 were $21.6 million, with a focus on product development and manufacturing capacity, which is where this advanced machinery sits. It's all about making complex parts faster and with less waste.
E-commerce and direct-to-consumer (DTC) sales models require robust digital platforms.
Smith & Wesson is quietly building out its digital platform to support a Direct-to-Consumer (DTC) model, though the actual firearms still must ship to a licensed dealer (Federal Firearms Licensee or FFL). This shift is less about selling guns directly and more about controlling the customer experience and selling high-margin accessories and merchandise.
Based on projections, the company's online sales are expected to hit approximately $73.4 million in 2025, representing about 15.5% of their total Net Sales of $474.7 million. This is a significant revenue stream that requires a robust, secure, and user-friendly digital platform. The company's 2025 10-K report confirms they are investing in technology infrastructure to 'streamline operations and improve efficiency' and that their digital platforms 'support future sales growth and profitability.'
The table below shows the clear revenue breakdown, underscoring why the DTC platform for accessories is a high-priority area for growth and margin protection.
| Metric | Fiscal Year 2025 Value | Significance to Technology Strategy |
|---|---|---|
| Total Net Sales | $474.7 million | Context for all revenue streams. |
| Handgun Sales | $331.9 million | Core market driven by polymer (M&P) and CNC-machined products. |
| Projected DTC/Online Sales | ~$73.4 million | Growing revenue stream requiring robust e-commerce platform investment. |
| Capital Expenditures | $21.6 million | Investment in manufacturing capacity, likely including new CNC machinery. |
Smith & Wesson Brands, Inc. (SWBI) - PESTLE Analysis: Legal factors
Product liability lawsuits and state-level litigation pose significant financial risk.
The firearms industry, and Smith & Wesson Brands, Inc. specifically, operates under a constant, material threat of litigation that can't be fully quantified. While the federal Protection of Lawful Commerce in Arms Act (PLCAA) generally shields manufacturers from liability for the criminal misuse of their products, state-level litigation and new statutes are actively working to bypass this protection.
For example, new state laws in places like New York and Connecticut create new liability rules, such as holding manufacturers accountable for creating a 'public nuisance' or failing to prevent unlawful gun possession. This forces the company to accrue defense costs for multiple product-liability and municipal/class matters. Honestly, the company itself states it cannot reasonably estimate a reasonably possible range of additional losses, which means the financial risk is substantial and unhedged.
On the flip side, a major legal cloud lifted in 2025. The U.S. Supreme Court ruled in favor of Smith & Wesson Brands, Inc. in the high-profile Estados Unidos Mexicanos v. Smith & Wesson Brands, Inc. case on June 5, 2025, which sought billions in damages. The district court later dismissed that action, removing a potential $10 billion liability claim from the books. That was a defintely necessary win.
Federal court rulings on the Second Amendment (e.g., Bruen decision) expand carry rights, boosting demand.
The Supreme Court's 2022 New York State Rifle & Pistol Association, Inc. v. Bruen decision fundamentally changed the legal landscape by establishing a 'text and history' standard for Second Amendment challenges. This ruling effectively expanded the right to carry a firearm in public across many states, which directly fuels demand for Smith & Wesson Brands, Inc.'s core products, especially handguns.
The immediate effect is clear in the numbers. In the first quarter of fiscal year 2026 (ended July 31, 2025), Handgun sales rose to $64,944k, a 21.9% increase year-over-year, with handgun units shipped jumping 35.3% (161k units vs. 119k units). This surge in handgun demand is a direct benefit of the legal clarity and expanded carry rights stemming from the Bruen decision and subsequent lower-court rulings that struck down restrictive state licensing schemes.
Compliance with the patchwork of state-specific gun laws (e.g., magazine capacity limits) is complex.
While federal law is favorable to the industry, the reality on the ground is a confusing, expensive patchwork of state-level restrictions. Smith & Wesson Brands, Inc. must design, manufacture, and distribute products that comply with hundreds of varying state and local laws, which is a massive operational and legal headache.
This complexity is driven by a few key areas:
- Magazine Capacity Limits: States like Colorado ban the sale of magazines greater than 15 rounds, while others have different limits or outright bans.
- Assault Weapon Bans: Certain states restrict the sale of specific rifle models or features, forcing the company to produce state-compliant variants.
- Firearm Rosters: States like California maintain approved lists of handguns, requiring specific safety features and costly testing for each model.
The cost of this compliance-from separate manufacturing runs for state-specific models to increased legal counsel for navigating new statutes-is a constant drag on efficiency and gross margin. It's a logistical nightmare that limits economies of scale.
Trade restrictions and tariffs on raw materials impact supply chain legal agreements.
The legal and political environment around international trade directly impacts Smith & Wesson Brands, Inc.'s cost of goods sold. The company relies heavily on raw materials, primarily steel and aluminum, for its manufacturing process.
In the first quarter of fiscal year 2026, the company's Gross Margin was negatively impacted by a 120 basis point hit from tariffs, stemming primarily from steel. This is a clear example of a legal/political factor translating directly into a financial cost. The increase in Section 232 tariffs on steel and aluminum to 50% for many countries in mid-2025 further elevates this cost pressure, requiring renegotiation of supply chain agreements and potentially forcing domestic sourcing at higher prices.
Here's the quick math on the tariff impact:
| Metric (Q1 FY2026) | Value | Impact |
|---|---|---|
| Net Sales | $85,077k | Baseline for margin calculation. |
| Gross Margin (Reported) | 25.9% | Actual margin. |
| Tariff Negative Impact | 120 basis points | Direct cost from steel tariffs. |
| Gross Margin (Pre-Tariff Estimate) | 27.1% | What margin would have been without the tariff pressure. |
What this estimate hides is the long-term risk of supply chain disruption from these trade restrictions, which can lead to legal breaches with suppliers or customers if delivery schedules are missed.
Smith & Wesson Brands, Inc. (SWBI) - PESTLE Analysis: Environmental factors
You're looking for a clear-eyed view of Smith & Wesson Brands, Inc.'s environmental posture, and the direct takeaway is this: the company is compliant with core manufacturing regulations, but its public reporting on climate-related metrics lags significantly behind investor expectations in 2025. This creates a quantifiable transparency risk in a market increasingly focused on Environmental, Social, and Governance (ESG) performance.
Compliance with Environmental Protection Agency (EPA) regulations on manufacturing waste is mandatory.
For a heavy manufacturer like Smith &Wesson Brands, Inc., compliance with federal and state environmental laws is a non-negotiable cost of doing business. This includes the Clean Air Act, Clean Water Act, and the Resource Conservation and Recovery Act (RCRA) for hazardous waste disposal. The company must also manage remediation projects, such as at a designated site in Springfield, Massachusetts, under the Massachusetts Contingency Plan (MCP).
Here's the quick math on regulatory costs: Smith & Wesson Brands, Inc. reported spending $1.5 million in both fiscal year 2024 and fiscal year 2023 on environmental compliance, primarily covering disposal fees and containers. This consistent, multi-million-dollar expenditure is a baseline operational cost that must be factored into your valuation models, as it's defintely not going away.
Scope 1 and 2 carbon emissions reporting is an increasing investor expectation.
The biggest environmental transparency gap for Smith & Wesson Brands, Inc. is its lack of public disclosure on climate impact. In a year where California's Climate Corporate Data Accountability Act (SB 253) is pushing large US companies to report Scope 1 and 2 emissions starting in 2026, the current silence is a red flag for ESG-focused investors.
The company currently does not provide specific carbon emissions data (Scope 1, 2, or 3) and has not publicly committed to specific 2030 or 2050 climate goals through major frameworks like the Science Based Targets initiative (SBTi). This lack of measurable data puts them at a competitive disadvantage in sustainability rankings, which can impact institutional ownership. The company does have a Sustainability Committee, established to review environmental policies and related operational control matters, including energy use, water use, pollution, and hazardous waste handling.
Sustainable sourcing of materials (e.g., metals, polymers) is a growing supply chain priority.
The firearms business relies on key raw materials like steel, lead, brass, wood, and various polymers. The primary focus of their public sourcing efforts is on conflict minerals, driven by regulatory requirements. This is a good start, but it's limited in scope.
For fiscal year 2025, Smith & Wesson Brands, Inc. filed a Conflict Minerals Form SD in May 2025, detailing their due diligence efforts for the sourcing of tin, tantalum, tungsten, and gold (3TG) to ensure compliance with OECD Guidance. What this estimate hides, however, is the broader environmental footprint of their high-volume materials like steel and polymers, which are not covered by the conflict minerals rule but are increasingly scrutinized by stakeholders for their carbon intensity and circularity.
- Key Materials: Steel, wood, lead, brass, and plastics.
- Sourcing Focus: Due diligence on tin, tantalum, tungsten, and gold (3TG).
- Compliance Framework: OECD Guidance and Responsible Minerals Assurance Process (RMAP).
Noise and lead mitigation at company-owned shooting ranges requires ongoing management.
While Smith & Wesson Brands, Inc. is primarily a manufacturer, they operate testing facilities where lead and noise exposure are constant occupational hazards. OSHA (Occupational Safety and Health Administration) and CDC guidelines mandate strict controls to protect employees from airborne lead and excessive noise.
The regulatory limits are clear, so compliance is a daily operational task:
- Airborne Lead Limit: OSHA's Permissible Exposure Limit (PEL) for airborne lead is 50 $\mu g/m^3$ averaged over an 8-hour period.
- Noise Exposure Limit: OSHA's PEL for noise is 90 decibels, A-weighted (dBA), averaged over an 8-hour period.
The company must invest in specialized ventilation systems, use HEPA-filtered vacuums for cleaning, and provide medical surveillance for employees exposed above the action level of 30 $\mu g/m^3$. Failure to manage this risk can lead to significant OSHA fines and long-term litigation exposure related to employee health.
| Environmental Compliance Area | FY 2025 Status/Data Point | Near-Term Action/Risk |
|---|---|---|
| EPA/Waste Compliance Costs | Baseline cost of $1.5 million (FY 2024/2023 data) for disposal fees and containers. | Risk: Remediation costs at legacy sites (e.g., Springfield, MA) remain an ongoing liability. |
| Scope 1 & 2 Emissions | No specific data publicly reported; no 2030/2050 climate goals. | Risk: Significant investor pressure will increase as new state-level GHG disclosure laws take effect. |
| Sustainable Sourcing | Filed Conflict Minerals Form SD (May 2025) for 3TG (tin, tantalum, tungsten, gold). | Action: Expand due diligence beyond 3TG to include high-volume materials (steel, polymers) to meet broader ESG mandates. |
| Lead & Noise Mitigation | Required to comply with OSHA PEL of 50 $\mu g/m^3$ for lead and 90 dBA for noise. | Action: Continuous capital investment in ventilation and abatement systems at manufacturing and testing facilities. |
Finance: Draft a preliminary internal estimate of Scope 1 and 2 emissions by Q2 2026 to prepare for potential future regulatory requirements.
Disclaimer
All information, articles, and product details provided on this website are for general informational and educational purposes only. We do not claim any ownership over, nor do we intend to infringe upon, any trademarks, copyrights, logos, brand names, or other intellectual property mentioned or depicted on this site. Such intellectual property remains the property of its respective owners, and any references here are made solely for identification or informational purposes, without implying any affiliation, endorsement, or partnership.
We make no representations or warranties, express or implied, regarding the accuracy, completeness, or suitability of any content or products presented. Nothing on this website should be construed as legal, tax, investment, financial, medical, or other professional advice. In addition, no part of this site—including articles or product references—constitutes a solicitation, recommendation, endorsement, advertisement, or offer to buy or sell any securities, franchises, or other financial instruments, particularly in jurisdictions where such activity would be unlawful.
All content is of a general nature and may not address the specific circumstances of any individual or entity. It is not a substitute for professional advice or services. Any actions you take based on the information provided here are strictly at your own risk. You accept full responsibility for any decisions or outcomes arising from your use of this website and agree to release us from any liability in connection with your use of, or reliance upon, the content or products found herein.