
|
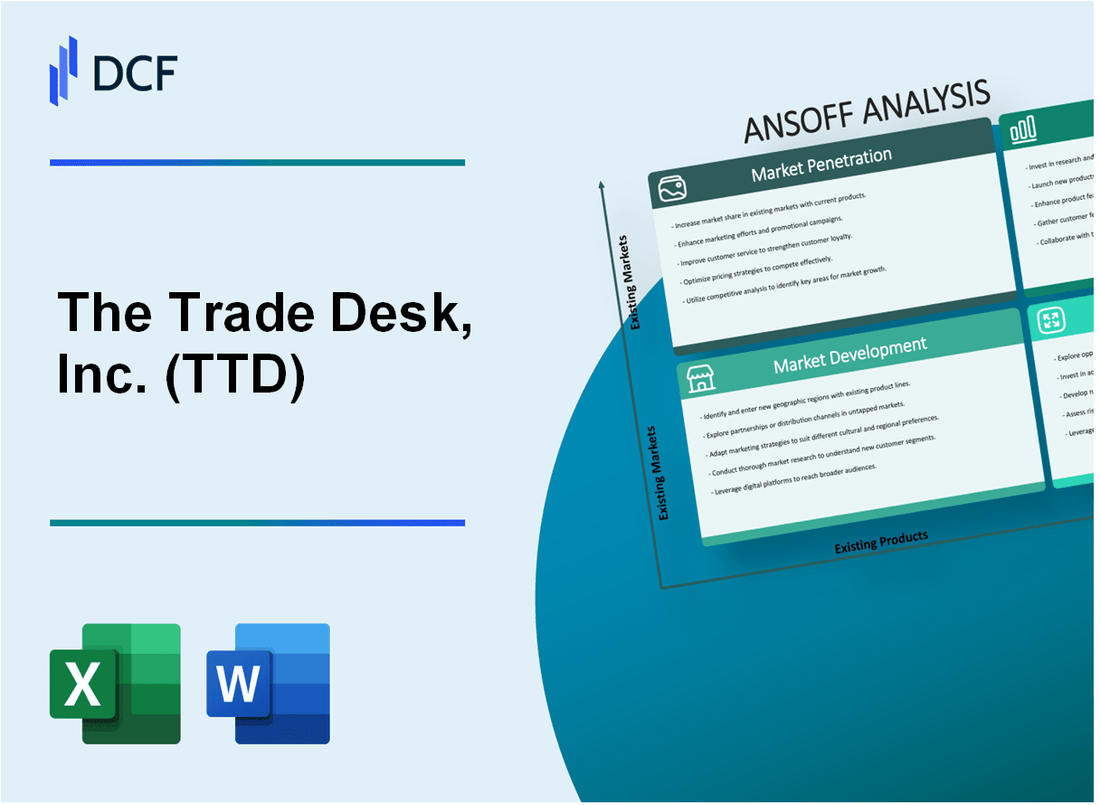
The Trade Desk, Inc. (TTD): ANSOFF MATRIX [Dec-2025 Updated] |
Fully Editable: Tailor To Your Needs In Excel Or Sheets
Professional Design: Trusted, Industry-Standard Templates
Investor-Approved Valuation Models
MAC/PC Compatible, Fully Unlocked
No Expertise Is Needed; Easy To Follow
The Trade Desk, Inc. (TTD) Bundle
You're staring at The Trade Desk, Inc.'s (TTD) chart, wondering how they keep that growth engine running hot, and frankly, I get it; mapping aggressive expansion is tough. I've broken down their entire playbook using the Ansoff Matrix, showing you the four distinct lanes they can accelerate down-from squeezing more spend share out of current clients using Solimar's optimization tools to the boldest moves like acquiring a specialized data clean room provider. This is the clear map you need to see where the next big investment opportunity lies. See the breakdown below to understand the near-term execution versus the long-term bets.
The Trade Desk, Inc. (TTD) - Ansoff Matrix: Market Penetration
You're looking at how The Trade Desk, Inc. (TTD) can get more business from the clients it already has. This is about deepening the relationship and increasing the share of wallet, which is often the safest growth path.
Increase spend share from existing advertisers using Solimar's optimization tools.
The Trade Desk, Inc. is pushing its AI-fueled platform, Kokai, to drive more spend from current users. By the second quarter of 2025, over 70% of spend was running through Kokai, and management expected full adoption by the end of 2025. Early adopters of this platform saw a 24% reduction in cost per conversion and a 20% decrease in cost per acquisition. This performance improvement helps justify increased investment on the platform.
Drive higher adoption of Connected TV (CTV) inventory among current clients.
CTV is the engine here; it remains the largest and fastest-growing channel for The Trade Desk, Inc.. In the third quarter of 2025, Video (which includes CTV) represented about 50% of the business. Revenue from advertising deal-making for connected TV and video platforms specifically increased 36% year-over-year in Q3 2025, reaching $301 million. The overall company revenue for Q3 2025 was $739 million, showing the scale of this segment.
Offer more defintely favorable pricing tiers for high-volume, long-term commitments.
While specific tier pricing isn't public, the success of this strategy is reflected in client stickiness. Customer retention has stayed above 95% for the past 11 consecutive years. This high retention suggests existing clients are finding enough value to maintain or increase their spend year after year, regardless of minor economic shifts.
Deepen integration with major agency holding companies for preferred platform status.
The Trade Desk, Inc. focuses on being the open platform choice. North America accounted for 87% of the business in Q3 2025, showing the depth of penetration in its core market. The company supports over 225 partners worldwide.
Expand Unified ID 2.0 (UID2) adoption to displace cookie-based competitors in existing campaigns.
UID2 is critical for maintaining targeting capability as cookies fade. When The Trade Desk, Inc. used UID2 for display ads, the cost per acquisition (CPA) was $1.60, compared to $5.37 for non-UID2 segments-that's a 2.4 times improvement. Furthermore, the click-through rate (CTR) for UID2-based ads was 2.9 times higher than for non-UID2 ads. Analysts estimate this adoption could drive over $200 million in incremental annual revenue by 2026.
Here's a quick look at the financial scale supporting these penetration efforts:
| Metric | Value (Latest Reported) | Period/Context |
| Q3 2025 Revenue | $739 million | Three Months Ended September 30, 2025 |
| Year-over-Year Revenue Growth | 18% | Q3 2025 vs. Q3 2024 |
| Video/CTV Revenue Share | Around 50% | Q3 2025 Business Segment |
| Customer Retention Rate | Over 95% | Q3 2025, 11th consecutive year |
| UID2 CPA Improvement | 2.4 times better | Compared to non-UID2 segments |
| Kokai Spend Adoption | Over 70% | By Q2 2025 |
The platform's ability to maintain high client satisfaction while pushing new technology is evident in several operational metrics:
- Net cash provided by operating activities was $225 million in Q3 2025.
- Free cash flow was $155 million in Q3 2025.
- Adjusted EBITDA margin was 43% of revenue in Q3 2025, totaling $317 million.
- The company had about $1.4 billion in cash, cash equivalents, and short-term investments at the end of Q3 2025.
- The board approved an additional $500 million share repurchase authorization in Q3 2025.
The Trade Desk, Inc. (TTD) - Ansoff Matrix: Market Development
You're looking at where The Trade Desk, Inc. can take its existing platform to new customers, which is the essence of Market Development. It's about finding new territories or new types of buyers for the established self-service cloud-based platform.
Aggressively target new geographic markets like Japan and India for programmatic expansion.
The Trade Desk, Inc. is clearly prioritizing international growth, which outpaced North America for the ninth quarter in a row in the last reported quarter. Still, the current geographic spend distribution shows a massive opportunity: The Trade Desk, Inc. is generating only about 12% of its spend internationally, even though 60% of global ad dollars are spent outside North America. This disparity signals significant headroom for expansion in regions like APAC and EMEA.
Focus sales teams on new vertical markets, specifically Retail Media Networks outside of the US.
The focus on Retail Media Networks is smart, given the market size. Global retail media is projected to hit $177 billion in 2025. The Trade Desk, Inc. is already embedding itself here; for example, it partnered with Koddi to expand into onsite retail inventory through Gopuff. Also, DoorDash enabled flexible switching between managed and programmatic display through The Trade Desk, Inc., showing traction in this vertical outside of the US core.
Tailor the platform for Small and Medium-sized Businesses (SMBs) via a self-service model.
Addressing the SMB segment directly is a clear market development move. In late November 2025, Intuit announced that its SMB MediaLabs audiences, powered by first-party business data, are now available on The Trade Desk, Inc. platform. This integration grants advertisers access to highly sought-after small and mid-market business segments with increased precision, directly supporting the self-service model by providing valuable, verified data for smaller advertisers to use.
Establish strategic partnerships with local Demand-Side Platforms (DSPs) in emerging economies.
While specific local DSP partnerships in emerging economies aren't always public, the company's overall partnership strategy is robust, focusing on supply chain transparency. The OpenPath initiative, for instance, directly connects publishers to The Trade Desk, Inc. platform, enhancing supply chain efficiency. The New York Post, after integrating with OpenPath, saw its inventory fill-rate increase by 8.6x and revenue across programmatic web display increase by 97% in one year.
Convert traditional linear TV ad spenders to programmatic via education and guaranteed outcomes.
The shift from traditional TV to streaming is undeniable, and The Trade Desk, Inc. is positioned to capture that spend. Connected TV (CTV) ads currently account for about 48% of The Trade Desk, Inc.'s sales. The company champions independent measurement, like through its work with iSpot.tv, to prove the incremental reach CTV delivers beyond linear. This helps marketers optimize spend and avoid waste, which is key to converting traditional buyers who rely on older measurement standards. Clients using the Kokai platform are seeing tangible outcomes that educate and convert: a 24% lower cost per conversion and a 20% lower cost per acquisition.
Here's a quick look at some of the latest performance metrics supporting this growth strategy:
| Metric Category | Data Point | Period/Context |
| Revenue (Latest Quarter) | $739 million | Q3 2025 Total Revenue |
| Revenue Growth (Latest Quarter) | 18% year-over-year | Q3 2025 |
| Revenue (Prior Quarter) | $616 million | Q1 2025 Total Revenue |
| Revenue Growth (Prior Quarter) | 25% year-over-year | Q1 2025 |
| Customer Retention | Over 95% | For the past 11 consecutive years |
| CTV Sales Contribution | 48% | Of total sales |
| Retail Media Market Projection | $177 billion | Global projection for 2025 |
The Trade Desk, Inc. continues to invest heavily in platform innovation to support this market development. You can see the focus on AI and platform upgrades:
- Adoption of the new Kokai platform accelerated to cover two-thirds of clients as of Q1 2025.
- New Koa Adaptive Trading Modes are set for select agencies in late 2025.
- Audience Unlimited, a data marketplace upgrade, is rolling out in late 2025.
- The company used $310 million to repurchase Class A shares in Q3 2025.
Finance: draft 13-week cash view by Friday.
The Trade Desk, Inc. (TTD) - Ansoff Matrix: Product Development
You're looking at how The Trade Desk, Inc. (TTD) is pushing new products into its existing market of advertisers and agencies. This is all about making the core platform, Kokai, significantly better and more automated for the clients you already serve.
The focus on advanced measurement tools is clear. You saw the launch of Audience Unlimited on September 29, 2025, which is a major overhaul to the data marketplace. This new system includes AI-powered data scoring and tiered pricing models set at 3.3% and 4.4% of impression costs, designed to address historical advertiser reluctance where third-party data usage could consume nearly 20% of media spend. Furthermore, the enhanced campaign management tools integrate measurement indices like the Retail Sales Index for online/offline sales correlation, the TV Quality Index, and the Quality Reach Index.
The push toward automation is heavily reliant on AI integration. The new Koa Adaptive Trading Modes, specifically Performance Mode, is set to be available for select agencies in late 2025. In this mode, Koa acts as a full co-pilot, dynamically optimizing bids and allocation based on advertiser strategy and guardrails. This builds on the momentum of the core platform, where Kokai adoption reached nearly 85% of clients as the default experience by the third quarter of 2025.
The results from this product development are already showing up in key performance indicators (KPIs) for those using the new system. Clients shifting the majority of their spend to Kokai are accelerating their overall investment with The Trade Desk, Inc.. The company is pushing for full client migration from the legacy Solimar platform to Kokai by the end of 2025.
While a dedicated module for Digital Out-of-Home (DOOH) wasn't detailed with specific metrics, the growth in video, which includes Connected TV (CTV), remains a core driver. CTV is the largest and fastest-growing channel, representing around 50% of the business in Q3 2025. The platform also saw customer retention remain above 95% for the eleventh straight year.
Here is a snapshot of the recent financial performance and product adoption metrics you should track:
| Metric Category | Specific Metric | Value / Amount | Period / Context |
|---|---|---|---|
| Financial Performance | Q3 2025 Revenue | $739 million | Q3 2025 |
| Financial Performance | Q3 2025 Revenue Growth (Excluding Political) | 22% year-over-year | Q3 2025 |
| Financial Performance | Q3 2025 Adjusted EBITDA Margin | 43% | Q3 2025 |
| Financial Performance | Q4 2025 Revenue Guidance (Minimum) | At least $840 million | Q4 2025 Guidance |
| Product Adoption | Kokai Platform Adoption | Nearly 85% of clients | Q3 2025 |
| Product Performance | Cost Per Acquisition Improvement (Kokai Users) | 26% decrease | For clients using Kokai |
| Product Performance | Cost Per Unique Reach Improvement (Kokai Users) | 58% improvement | For clients using Kokai |
| Product Development | Audience Unlimited Data Pricing Tiers | 3.3% and 4.4% of impression costs | New Data Marketplace |
| Financial Health | Q3 Free Cash Flow | $155 million | Q3 2025 |
The platform enhancements are directly tied to operational efficiency. For example, the new workflow capabilities support the goal of complete client migration to Kokai by the end of 2025. You should watch the adoption rate of the new Koa Adaptive Trading Modes as they roll out to select agencies in late 2025.
The Trade Desk, Inc. also continued returning capital to shareholders. They used $310 million in Q3 to repurchase Class A shares and the board approved an additional $500 million authorization in October.
- CTV/Video segment share of business: around 50% in Q3.
- Mobile segment share of business: low 30s percentage in Q3.
- International revenue contribution: 13% in Q3.
- Customer Retention: over 95% for 11 consecutive years.
Finance: draft 13-week cash view by Friday.
The Trade Desk, Inc. (TTD) - Ansoff Matrix: Diversification
You're looking at how The Trade Desk, Inc. is expanding beyond its core demand-side platform (DSP) business, which is a classic diversification play in the Ansoff Matrix, using its strong financial footing to fund these moves.
The company's third quarter of 2025 showed revenue of $739 million, which was an 18% increase year-over-year. For the nine months ended September 30, 2025, total revenue reached $2,049 million. Net income for Q3 2025 was $116 million, yielding a net income margin of 16%. Adjusted EBITDA for the quarter was $317 million, representing 43% of revenue. The Trade Desk, Inc. ended Q3 2025 with about $1.4 billion in cash, cash equivalents, and short-term investments.
The Trade Desk, Inc. guided for fourth quarter 2025 revenue to be at least $840 million, with an expected Adjusted EBITDA of approximately $375 million. The company also authorized an additional $500 million for its share repurchase program.
The strategic diversification efforts are visible in recent product and structural changes:
- Acquire a specialized data clean room provider to offer a privacy-centric data collaboration service.
- Develop a proprietary identity resolution service to compete directly with walled gardens.
- Launch a financial trading platform for media futures contracts, creating a new asset class.
- Invest in a content recommendation engine for publishers, moving into the supply side business.
- Offer consulting services to brands on building and managing their first-party data strategies.
The acquisition of Sincera, a digital advertising data company, was announced in January 2024, with an expected close in the first quarter of 2025, aimed at enhancing data accuracy and transparency. The company's Galileo offering enables first-party data activation and has direct integrations with clean room providers like Adobe, Habu, and Snowflake. The Trade Desk, Inc. continues to build support for Unified ID 2.0 (UID2), an industry-wide identity approach.
Moving into new verticals and publisher-facing tools shows a diversification of revenue streams. The company launched a Pharma ad marketplace in Q3 2025, consolidating healthcare professional (HCP) and direct-to-consumer (DTC) targeting. Furthermore, the launch of OpenAds, an open-source auction, promotes transparency for buyers and publishers. The company's core video channel, which includes CTV, represented around 50% of the business in Q3 2025. Mobile represented a low 30s percentage share.
Here's a quick look at the financial scale and product adoption supporting these strategic moves:
| Metric | Value (2025 Data) | Context |
| Q3 2025 Revenue | $739 million | 18% year-over-year growth. |
| Q3 2025 Adjusted EBITDA Margin | 43% | $317 million in Adjusted EBITDA. |
| Q4 2025 Revenue Guidance | At least $840 million | Implied growth of approximately 18.5% excluding political spend. |
| Kokai Platform Adoption | Nearly 85% of clients | The latest AI-powered platform experience. |
| North America Revenue Share (Q3) | 87% | International revenue share was 13%. |
The Trade Desk, Inc. is also deepening retail media capabilities, for example, through an alliance with Instacart in June 2025, enabling advertisers to use first-party purchase data. This focus on first-party data activation is a key part of the strategy to help clients manage data as third-party cookies phase out.
The company's customer retention remained above 95% for the eleventh straight year in Q3 2025.
Disclaimer
All information, articles, and product details provided on this website are for general informational and educational purposes only. We do not claim any ownership over, nor do we intend to infringe upon, any trademarks, copyrights, logos, brand names, or other intellectual property mentioned or depicted on this site. Such intellectual property remains the property of its respective owners, and any references here are made solely for identification or informational purposes, without implying any affiliation, endorsement, or partnership.
We make no representations or warranties, express or implied, regarding the accuracy, completeness, or suitability of any content or products presented. Nothing on this website should be construed as legal, tax, investment, financial, medical, or other professional advice. In addition, no part of this site—including articles or product references—constitutes a solicitation, recommendation, endorsement, advertisement, or offer to buy or sell any securities, franchises, or other financial instruments, particularly in jurisdictions where such activity would be unlawful.
All content is of a general nature and may not address the specific circumstances of any individual or entity. It is not a substitute for professional advice or services. Any actions you take based on the information provided here are strictly at your own risk. You accept full responsibility for any decisions or outcomes arising from your use of this website and agree to release us from any liability in connection with your use of, or reliance upon, the content or products found herein.