
|
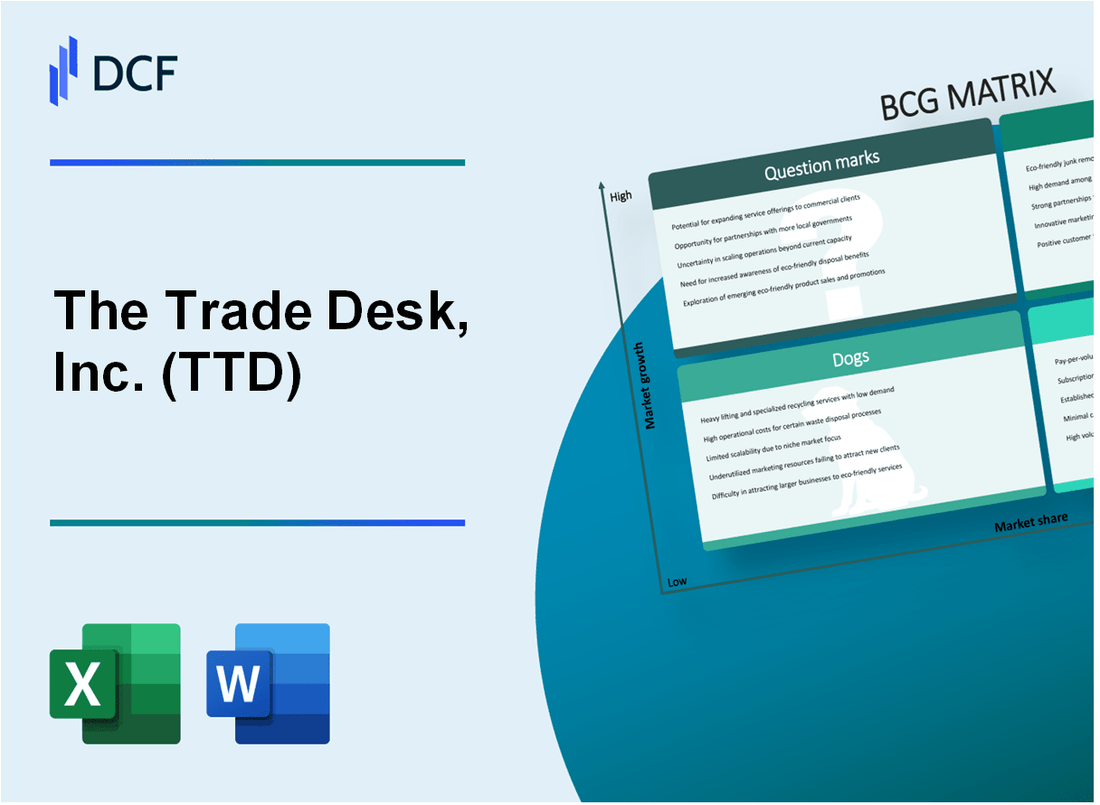
The Trade Desk, Inc. (TTD): BCG Matrix [Dec-2025 Updated] |
Fully Editable: Tailor To Your Needs In Excel Or Sheets
Professional Design: Trusted, Industry-Standard Templates
Investor-Approved Valuation Models
MAC/PC Compatible, Fully Unlocked
No Expertise Is Needed; Easy To Follow
The Trade Desk, Inc. (TTD) Bundle
You're looking at The Trade Desk, Inc.'s business as of late 2025, and honestly, it maps perfectly to the BCG Matrix: the engine is roaring, but where do we place the next big bet? The Stars quadrant is dominated by Connected TV advertising, hitting 50% of Q3 revenue, supported by the 85% adoption of Kokai AI, all sitting atop a Cash Cow core that just printed $155$ million in Q3 free cash flow with a 43% margin. But we can't ignore the Dogs-like traditional display-or the big, uncertain Question Marks, such as international expansion making up only 13% of sales right now. Dive in below to see the full breakdown of where The Trade Desk, Inc. is winning, where it's coasting, and where the next fight for market share will be won or lost.
Background of The Trade Desk, Inc. (TTD)
You're looking at The Trade Desk, Inc. (TTD) as of late 2025, and the picture is one of a technology company that provides a global platform for those buying advertising. Honestly, they've built a solid business on the premise of programmatic advertising, which is just using data and automation to buy ad placements in real time across things like web, mobile, and connected TV (CTV).
Let's look at the most recent numbers we have, which come from their third quarter ending September 30, 2025. For that quarter, The Trade Desk, Inc. posted revenue of $739 million, which was an 18% jump year-over-year. If you strip out the political ad spend, that growth was closer to 22%, showing strong underlying demand for their core services.
The operating model looks quite healthy, too. Adjusted EBITDA for Q3 2025 hit approximately $317 million, translating to a very strong 43% margin on that revenue. Plus, they generated $225 million in cash from operations and ended the quarter with about $1.4 billion in cash, cash equivalents, and short-term investments, all while carrying no debt on the balance sheet.
You should know that their platform, which they call Kokai, is central to their current success, fueling momentum alongside major areas like CTV and retail media. For instance, CTV remains their largest and fastest-growing channel, outpacing the overall business growth in Q3 2025. In terms of where the money comes from geographically, North America still accounts for a hefty 87% of the business, with international making up the remaining 13%.
The Trade Desk, Inc. has also been busy innovating right at the end of the year. They rolled out major platform upgrades like Audience Unlimited and Koa Adaptive Trading Modes to select agencies in late 2025, aiming to boost data use and performance ahead of a wider release in early 2026. Furthermore, they've maintained customer retention above 95% for 11 straight years, which is defintely a testament to client satisfaction.
Looking ahead, management gave guidance for the fourth quarter of 2025, expecting revenue to be at least $840 million and Adjusted EBITDA around $375 million. They are also committed to returning capital, having used $310 million for share repurchases in Q3 and announcing an additional $500 million authorization shortly after.
Finance: draft 13-week cash view by Friday.
The Trade Desk, Inc. (TTD) - BCG Matrix: Stars
Stars are defined by having high market share in a growing market. The business units or products with the best market share and generating the most cash are considered Stars. Monopolies and first-to-market products are frequently termed Stars too. Because of their high growth rate, Stars consume large amounts of cash, which generally results in the same amount of money coming in that is going out. Stars can eventually become Cash Cows if they sustain their success until a time when a high-growth market slows down. A key tenet of a Boston Consulting Group (BCG) strategy for growth is to invest in Stars.
Connected TV (CTV) advertising is a primary Star component for The Trade Desk, Inc. This channel is the largest and fastest-growing, representing around 50% of Q3 2025 revenue. The Trade Desk, Inc.'s Q3 2025 total revenue reached $739 million, with this video segment growing faster than the overall business. The shift to biddable CTV is accelerating, making this a critical area for continued investment.
Unified ID 2.0 (UID2) adoption is another key Star element, gaining global support as a critical, privacy-centric alternative to third-party cookies. UID2 is an industry-wide, email-based identifier that enables targeted advertising without reliance on those cookies. It is designed to be interoperable and portable across the web, mobile apps, and Connected TV, supporting cross-device identity strategies.
The Kokai AI platform is seeing rapid adoption, with nearly 85% of clients using it by late 2025, driving campaign performance gains. This platform integrates advanced AI to enhance measurement and user experience. Clients shifting the majority of their spend to Kokai are increasing their overall investment in The Trade Desk, Inc. more than 20% faster than others. Campaigns running on Kokai are showing more than a 20-point increase across key performance indicators.
| Performance Metric Comparison | Improvement on Kokai vs. Previous Platform |
| Price Drop per Unique Reach | 24% |
| Cost Per Acquisition (CPA) Declines | Between 20% and 34% |
| Key Performance Metrics Improvement | 25% |
Retail Media is a high-growth vertical that is scaling rapidly by leveraging first-party data for major brands. The Trade Desk, Inc. is positioned to capture market share as advertisers increasingly value the efficiency and measurable results in this area. The global retail media platform market was expected to reach USD 17.99 billion in 2025. The third-party media networks segment within this market is projected to be the fastest-growing from 2025 to 2033.
- Customer retention for The Trade Desk, Inc. remained over 95% during Q3 2025, marking the eleventh consecutive year above this threshold.
- International revenue growth in Q3 2025 was outpacing North America, with International representing about 13% of the business.
- The Trade Desk, Inc. generated $225 million in net cash provided by operating activities in Q3 2025.
- The company held about $1.4 billion in cash, cash equivalents, and short-term investments at the end of Q3 2025.
The Trade Desk, Inc. (TTD) - BCG Matrix: Cash Cows
You're looking at the engine room of The Trade Desk, Inc. (TTD) operations-the established core business that reliably funds the company's growth ambitions. This is where the high market share in mature areas translates directly into shareholder value. The core Demand-Side Platform (DSP) model, which has been refined over years, is clearly demonstrating its power to generate significant liquidity. We saw this directly in the third quarter of 2025, where the business generated a substantial free cash flow of $155 million in that period alone.
This cash generation comes with excellent margin discipline. For Q3 2025, The Trade Desk, Inc. posted an Adjusted EBITDA of approximately $317 million, which translates to a very healthy margin of about 43% of revenue. Honestly, that level of profitability in a segment that isn't the fastest growing shows you how much operational leverage they've built into the platform. You don't need heavy promotional spending when you're this entrenched.
Stability is the hallmark of a great Cash Cow, and The Trade Desk, Inc. has that in spades with its client base. Customer retention has been exceptional, staying above 95% for 11 consecutive years as of Q3 2025. That kind of stickiness ensures a highly predictable revenue base, letting management focus on efficiency improvements rather than constantly chasing new logos just to stay flat.
The established programmatic display and mobile segments fit this profile perfectly. They aren't the high-growth stars like Connected TV (CTV), but they are mature, reliable contributors that consume less in new investment relative to the cash they return. Here's a quick look at the revenue mix from Q3 2025 to show you where that reliable spend is coming from:
| Segment | Approximate Revenue Share (Q3 2025) |
| Video (including CTV) | Around 50% |
| Mobile | Low 30s percentage share |
| Display | Low double-digit share |
| Audio | Around 5% |
The Display and Mobile segments, which together represent a significant portion of the business-well over 40%-are the classic Cash Cow territory here. They are mature, but they provide the necessary scale and cash flow to fund the development of newer areas, like the faster-growing CTV channel, or to support corporate overhead. Investing in infrastructure here, like the ongoing migration to the Kokai platform, is smart because it directly boosts efficiency and cash flow, which is exactly what you want from a Cash Cow.
The Trade Desk, Inc. (TTD) - BCG Matrix: Dogs
Dogs are business units or products characterized by a low market share within a low-growth market. For The Trade Desk, Inc., these segments tie up capital without generating significant returns, making divestiture a common strategic consideration.
Traditional display advertising fits this profile. In Q3 2025, this segment represented a low double-digit share of total revenue. This market is highly commoditized, meaning The Trade Desk, Inc.'s advanced technology provides less differentiation compared to its performance in premium inventory environments.
Smaller, slower-growing channels also fall into this quadrant. The Audio segment, for instance, accounted for around 5% of The Trade Desk, Inc.'s Q3 2025 revenue. The Digital Out-of-Home (DOOH) segment is similarly smaller and exhibits growth rates that lag behind the Connected TV (CTV) channel, which represented around 50% of Q3 video revenue.
The following table summarizes the approximate revenue contribution of these lower-growth channels based on Q3 2025 figures:
| Segment | Q3 2025 Revenue Share | Growth Context Relative to CTV |
| Traditional Display | Low double-digit percentage | Highly commoditized, lower growth |
| Audio | Around 5% | Slower growth |
| Digital Out-of-Home (DOOH) | Smaller channel share | Slower growth |
Legacy platform features are also candidates for the Dogs quadrant. The Trade Desk, Inc. is actively phasing out the Solimar interface in favor of the new Kokai platform, with the goal of transitioning the entire client roster by the end of 2025. While a majority of clients are already on Kokai, the ongoing migration and user resistance to the new interface suggest that continued investment in maintaining or supporting the legacy Solimar features yields diminishing returns, as resources are being redirected to the newer technology.
Furthermore, The Trade Desk, Inc. deals with inventory sources that are highly fragmented and represent the long-tail of the open internet. In these areas, where inventory quality and audience concentration are lower, the platform's superior targeting capabilities offer a less pronounced competitive advantage than they do when applied to premium CTV inventory. This results in lower overall yield and less efficient use of platform resources for these specific inventory pools.
- The Trade Desk, Inc.'s Q3 2025 total revenue was $739 million.
- Video (including CTV) represented around 50% of Q3 2025 business.
- Mobile represented a low 30s percentage share of Q3 2025 business.
- The company maintained customer retention above 95 percent for the eleventh straight year.
- The Trade Desk, Inc. had about $1.4 billion in cash, cash equivalents, and short-term investments at the end of Q3 2025.
Expensive turn-around plans for these segments are generally avoided, as the market dynamics suggest that significant capital deployment would be required to meaningfully shift the low-growth, low-share positioning against established competitors or superior internal growth drivers like CTV.
The Trade Desk, Inc. (TTD) - BCG Matrix: Question Marks
You're looking at the areas of The Trade Desk, Inc. (TTD) that are burning cash now for a shot at future dominance. These are the Question Marks-high potential, but not yet proven market leaders. They consume capital because they are in growing markets, but their current market share is relatively low, meaning they haven't fully captured the upside yet.
Consider the international push. As of Q3 2025, business outside the US accounted for only 13% of revenue, which was $739 million for the quarter. While North America represented 87% of the business in Q3, management noted that international growth is 'growing significantly faster' than North America. This 13% slice represents a massive, untapped global ad market opportunity that requires heavy investment to build out share against entrenched local players.
The OpenPath initiative is another classic Question Mark. This new supply path technology is a high-investment area, yet it 'Grew by many hundreds of percentage points this year'. This explosive growth rate signals high market demand for transparency, but its absolute contribution to the total revenue base is still small enough to classify it as a Question Mark. It needs significant capital infusion to scale its adoption quickly before competitors solidify alternative paths.
New vertical-specific marketplaces demand similar strategic choices. Take the Pharma ad marketplace, for instance, which was announced alongside integrations with IQVIA and Swoop. Building out these specialized ecosystems requires heavy initial investment to gain the critical mass of inventory and demand necessary to secure meaningful market share in regulated, high-value verticals. These units are cash-intensive right now.
The primary risk for all these Question Marks is the deceleration of overall growth. The Q3 2025 reported revenue growth was 18% year-over-year. That is a noticeable slowdown when you compare it to the accelerated growth of 26% seen in the full fiscal year 2024. You have to fix this growth gap, or these promising ventures will quickly slide into the Dog quadrant.
Here's a quick look at how the recent growth compares, showing the pressure on these newer areas to accelerate:
| Metric | Value | Period |
|---|---|---|
| Revenue Growth (Reported) | 18% | Q3 2025 |
| Revenue Growth (Excluding Political Spend) | Approximately 22% | Q3 2025 |
| Annual Revenue Growth | 26% | Fiscal Year 2024 |
| International Revenue Share | 13% | Q3 2025 |
To manage these, The Trade Desk, Inc. is making moves. They appointed a new COO, CFO, and CRO to drive operational progress and scale sales effectiveness. The company also reinforced its financial discipline by announcing a new $500 million share repurchase authorization, while holding about $1.4 billion in cash, cash equivalents, and short-term investments at the end of the quarter.
The strategy for these Question Marks boils down to clear choices, honestly. You either invest heavily to turn them into Stars, or you divest. The near-term focus must be on accelerating adoption for these key growth vectors:
- International expansion to capture non-US spend.
- Scaling OpenPath adoption for supply path optimization.
- Achieving critical mass in vertical marketplaces like Pharma.
If the 18% growth rate persists, the pressure to make a hard decision on investment levels for these segments will intensify before the next fiscal year review.
Finance: draft the projected cash burn for international build-out vs. OpenPath scaling by next Tuesday.
Disclaimer
All information, articles, and product details provided on this website are for general informational and educational purposes only. We do not claim any ownership over, nor do we intend to infringe upon, any trademarks, copyrights, logos, brand names, or other intellectual property mentioned or depicted on this site. Such intellectual property remains the property of its respective owners, and any references here are made solely for identification or informational purposes, without implying any affiliation, endorsement, or partnership.
We make no representations or warranties, express or implied, regarding the accuracy, completeness, or suitability of any content or products presented. Nothing on this website should be construed as legal, tax, investment, financial, medical, or other professional advice. In addition, no part of this site—including articles or product references—constitutes a solicitation, recommendation, endorsement, advertisement, or offer to buy or sell any securities, franchises, or other financial instruments, particularly in jurisdictions where such activity would be unlawful.
All content is of a general nature and may not address the specific circumstances of any individual or entity. It is not a substitute for professional advice or services. Any actions you take based on the information provided here are strictly at your own risk. You accept full responsibility for any decisions or outcomes arising from your use of this website and agree to release us from any liability in connection with your use of, or reliance upon, the content or products found herein.