
|
The Trade Desk, Inc. (TTD) DCF Valuation |
Fully Editable: Tailor To Your Needs In Excel Or Sheets
Professional Design: Trusted, Industry-Standard Templates
Investor-Approved Valuation Models
MAC/PC Compatible, Fully Unlocked
No Expertise Is Needed; Easy To Follow
The Trade Desk, Inc. (TTD) Bundle
Explore The Trade Desk, Inc. (TTD) financial outlook with our user-friendly DCF Calculator! Enter your projections for growth, margins, and expenses to calculate The Trade Desk, Inc. (TTD) intrinsic value and refine your investment approach.
What You Will Get
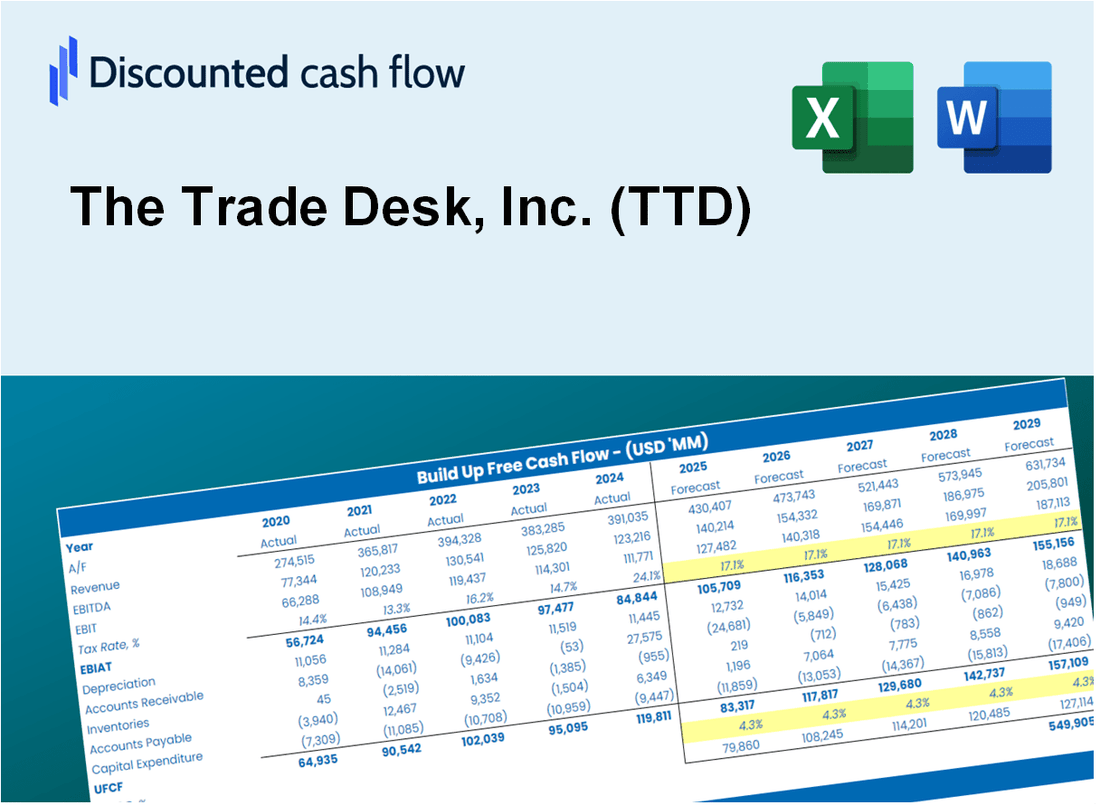
- Real TTD Financial Data: Pre-filled with The Trade Desk’s historical and projected data for precise analysis.
- Fully Editable Template: Modify key inputs like revenue growth, WACC, and EBITDA % with ease.
- Automatic Calculations: See The Trade Desk’s intrinsic value update instantly based on your changes.
- Professional Valuation Tool: Designed for investors, analysts, and consultants seeking accurate DCF results.
- User-Friendly Design: Simple structure and clear instructions for all experience levels.
Key Features
- Real-Life TTD Data: Pre-filled with The Trade Desk's historical financials and forward-looking projections.
- Fully Customizable Inputs: Adjust revenue growth, margins, WACC, tax rates, and capital expenditures.
- Dynamic Valuation Model: Automatic updates to Net Present Value (NPV) and intrinsic value based on your inputs.
- Scenario Testing: Create multiple forecast scenarios to analyze different valuation outcomes.
- User-Friendly Design: Simple, structured, and designed for professionals and beginners alike.
How It Works
- Step 1: Download the Excel file for The Trade Desk, Inc. (TTD).
- Step 2: Review The Trade Desk’s pre-filled financial data and forecasts.
- Step 3: Modify key inputs such as revenue growth, WACC, and tax rates (highlighted cells).
- Step 4: Observe the DCF model update in real-time as you adjust your assumptions.
- Step 5: Analyze the outputs and leverage the results for informed investment decisions.
Why Choose This Calculator for The Trade Desk, Inc. (TTD)?
- User-Friendly Interface: Perfectly crafted for both novices and seasoned professionals.
- Customizable Inputs: Easily adjust parameters to suit your specific analysis needs.
- Real-Time Valuation: Observe immediate updates to The Trade Desk's valuation as you tweak inputs.
- Pre-Configured Data: Comes with The Trade Desk's latest financial information for swift evaluations.
- Relied Upon by Experts: Favored by investors and analysts for making well-informed choices.
Who Should Use The Trade Desk, Inc. (TTD)?
- Advertisers: Optimize ad campaigns with advanced data-driven insights.
- Media Buyers: Streamline programmatic buying processes using a user-friendly platform.
- Marketing Professionals: Enhance targeting strategies with real-time analytics and reporting.
- Data Analysts: Leverage comprehensive datasets to uncover trends and improve ROI.
- Students and Educators: Explore digital advertising concepts and methodologies through practical applications.
What the Template Contains
- Preloaded TTD Data: Historical and projected financial data, including revenue, EBIT, and capital expenditures.
- DCF and WACC Models: Professional-grade sheets for calculating intrinsic value and Weighted Average Cost of Capital.
- Editable Inputs: Yellow-highlighted cells for adjusting revenue growth, tax rates, and discount rates.
- Financial Statements: Comprehensive annual and quarterly financials for deeper analysis.
- Key Ratios: Profitability, leverage, and efficiency ratios to evaluate performance.
- Dashboard and Charts: Visual summaries of valuation outcomes and assumptions.
Disclaimer
All information, articles, and product details provided on this website are for general informational and educational purposes only. We do not claim any ownership over, nor do we intend to infringe upon, any trademarks, copyrights, logos, brand names, or other intellectual property mentioned or depicted on this site. Such intellectual property remains the property of its respective owners, and any references here are made solely for identification or informational purposes, without implying any affiliation, endorsement, or partnership.
We make no representations or warranties, express or implied, regarding the accuracy, completeness, or suitability of any content or products presented. Nothing on this website should be construed as legal, tax, investment, financial, medical, or other professional advice. In addition, no part of this site—including articles or product references—constitutes a solicitation, recommendation, endorsement, advertisement, or offer to buy or sell any securities, franchises, or other financial instruments, particularly in jurisdictions where such activity would be unlawful.
All content is of a general nature and may not address the specific circumstances of any individual or entity. It is not a substitute for professional advice or services. Any actions you take based on the information provided here are strictly at your own risk. You accept full responsibility for any decisions or outcomes arising from your use of this website and agree to release us from any liability in connection with your use of, or reliance upon, the content or products found herein.