
|
Village Super Market, Inc. (VLGEA): 5 FORCES Analysis [Nov-2025 Updated] |
Fully Editable: Tailor To Your Needs In Excel Or Sheets
Professional Design: Trusted, Industry-Standard Templates
Investor-Approved Valuation Models
MAC/PC Compatible, Fully Unlocked
No Expertise Is Needed; Easy To Follow
Village Super Market, Inc. (VLGEA) Bundle
You're looking at Village Super Market, Inc. right now, and honestly, the story isn't just about its 34 stores; it's about its deep, complicated tie to the Wakefern cooperative. As a former analyst, I see a classic tug-of-war: you get massive supplier leverage through that membership, but you're still fighting giants like Kroger and Walmart in a razor-thin margin game. Consider this: the company posted $2.32 billion in revenue for FY 2025, yet same-store sales only nudged up 1.9% in Q3 2025, showing how hard it is to grow when customers have zero switching costs and digital transparency is high. We need to map out exactly where the pressure is coming from-suppliers, customers, or the sheer weight of the competition-to see if the $75 million CapEx budget for 2025 is enough to keep pace. Dive in below for the full, force-by-force breakdown.
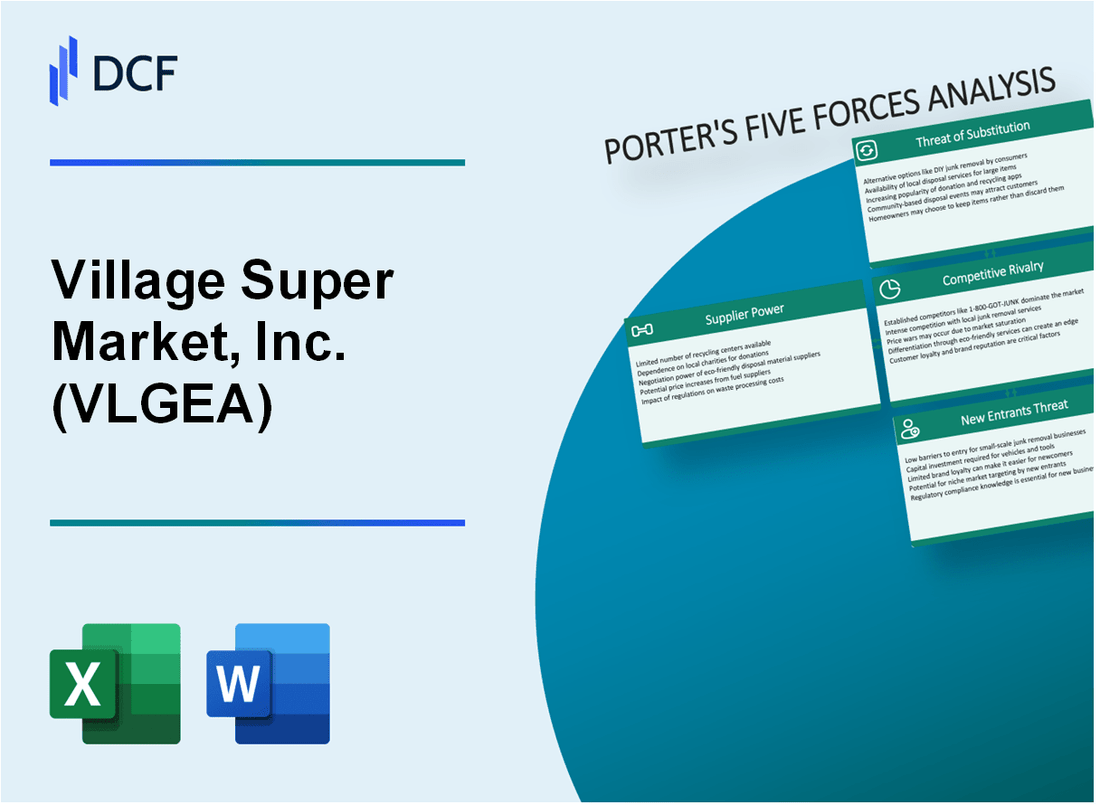
Village Super Market, Inc. (VLGEA) - Porter's Five Forces: Bargaining power of suppliers
The bargaining power of suppliers for Village Super Market, Inc. (VLGEA) is uniquely channeled through its relationship with Wakefern Food Corporation, the cooperative that acts as its primary wholesale supplier and brand owner.
VLGEA's 12.9% stake in Wakefern Food Corp. grants it significant collective purchasing power. As the second-largest member of the cooperative, Village Super Market, Inc. benefits from the massive scale in purchasing, distribution, and technology that being part of the nation's largest retailer-owned food cooperative provides. This collective leverage is intended to keep the cost of goods sold competitive against national chains.
Primary reliance on Wakefern for sourcing creates dependency, despite the cooperative benefits. Village Super Market, Inc. has a high dependence on Wakefern, with an 85% purchasing requirement noted in its operational highlights. This dependency means that while VLGEA gains leverage through the collective, it simultaneously cedes significant autonomy over its procurement strategy to the cooperative's central management and majority voting members.
Access to Wakefern's private label brands (Bowl & Basket) gives VLGEA margin control over national suppliers. The ability to offer high-margin private label products, such as Bowl & Basket, allows Village Super Market, Inc. to compete on price without solely relying on national brand pricing, which directly impacts its profitability against outside suppliers. The benefit from this structure is visible in the financial results, even with external pressures.
Here's a quick look at how the cooperative structure financially impacted Village Super Market, Inc. in fiscal year 2025:
| Financial Metric (FY 2025) | Amount/Percentage | Notes |
| Total Sales | $2,320,690 thousand | Total revenue for the fiscal year ending July 26, 2025. |
| Gross Profit Margin | 28.57% | Decreased slightly from 28.70% in FY 2024. |
| Patronage Dividends/Rebates from Wakefern | Offset margin decrease by 0.07% | Direct financial benefit received from the cooperative structure. |
| Demand Deposits Held at Wakefern | $92 million | Liquidity position tied directly to the cooperative entity. |
Recent internal disputes with Wakefern over market expansion introduce a new layer of supplier risk. The relationship has become strained, evidenced by Village Super Market, Inc.'s unsuccessful attempt to block Wakefern's acquisition of Morton Williams Supermarkets earlier in 2025. This action introduced explicit risk factors into Village Super Market, Inc.'s reporting, including the possibility of retaliation from Wakefern. The ultimate supplier risk is that Wakefern has the authority to remove Village Super Market, Inc. from the collective and revoke its permission to use key trademarks, which are integral to its operations.
The supplier power dynamic is therefore a double-edged sword for Village Super Market, Inc. You gain scale, but you risk losing control:
- Leverage Gained: Collective buying power for national brands.
- Dependency Created: Required to purchase 85% of goods through Wakefern.
- Brand Risk: Wakefern owns the ShopRite and Fairway trademarks.
- Financial Tie: $92 million in demand deposits held by the supplier.
Village Super Market, Inc. (VLGEA) - Porter's Five Forces: Bargaining power of customers
You're looking at Village Super Market, Inc. (VLGEA) and trying to gauge how much say the average shopper has in setting the terms. In the grocery business, the customer almost always holds the upper hand, and the numbers here confirm that pressure.
The core issue is that switching from one Village Super Market location to a competitor is often seamless. While Village Super Market operates 34 supermarkets across New Jersey, New York, Maryland, and Pennsylvania, plus three Gourmet Garage specialty markets, the sheer number of alternatives in the Mid-Atlantic region means customers can easily pivot to rivals like Walmart, Costco, Trader Joe's, or Aldi, who are actively cementing their price/value connection with shoppers.
Price sensitivity is naturally extreme because the industry operates on razor-thin margins. Look at Village Super Market's own performance; for the fourth quarter ended July 26, 2025, the gross profit margin was 28.2%, while net income was $15.5 million on revenue of $599.7 million. When margins are that tight, any sustained customer demand for lower prices directly threatens profitability. Furthermore, consumers have been inflation-weary, cutting back on spending and actively searching for deals, which forces Village Super Market to maintain competitive pricing, as seen in their Q4 2025 gross margin being lower than the prior year's Q4 2024 margin of 29.34%.
The digital shift is only amplifying this power dynamic. Digital channels offer shoppers instant price transparency and convenience, making it easier than ever to compare Village Super Market's shelf prices against online competitors. For instance, Village Super Market's same-store digital sales growth in Q3 2025 was a strong 10%, showing customers are actively using these tools. This growth, while positive for revenue, means customers are more informed and less tethered to a single physical location.
Here's a quick look at the operational scale versus the competitive environment:
| Metric | Village Super Market, Inc. (VLGEA) Data (2025) | Context/Implication |
|---|---|---|
| Total Supermarkets Operated | 34 | Regional concentration limits immediate choice compared to national giants. |
| Q3 2025 Same-Store Digital Sales Growth | 10% | Increases customer price transparency and ease of switching. |
| Full Year 2025 Revenue | $2,320.69 million | Scale must be maintained against competitors focused on price/value. |
| Q4 2025 Gross Profit Margin | 28.2% | Indicates the low-margin reality where price competition is fierce. |
| Store Replacement Size Increase | From 44,000 sq. ft. to 72,000 sq. ft. | Investment to enhance in-store experience to counter low switching costs. |
The customer's ability to exert pressure is evident in the strategic actions Village Super Market, Inc. must take just to maintain traffic. They are investing heavily in store modernization, such as replacing a 44,000 square foot location with a 72,000 square foot one, to improve the in-store experience and justify a purchase. This is a direct response to the threat of customers walking out the door.
You can see the direct impact of customer choice on Village Super Market, Inc.'s performance metrics:
- Full Year 2025 Same Store Sales Growth was 2.2%.
- Q3 2025 Net Income was $11.2 million, up 24% year-over-year, showing bottom-line sensitivity to sales volume.
- The company's full-year revenue growth over the past decade has been slow, around 3.57% CAGR, suggesting difficulty in significantly outpacing inflation against strong competition.
- In Q4 2025, net income rose only 0.6% to $15.5 million, despite revenue growth, highlighting margin pressure from customer demands.
Village Super Market, Inc. (VLGEA) - Porter's Five Forces: Competitive rivalry
The competitive rivalry facing Village Super Market, Inc. is fierce, stemming from the sheer scale of national behemoths and the localized pressure from regional players. You are operating in a market where the largest competitor, Walmart, reported U.S. grocery sales of $276 billion for its fiscal year 2025, which ended January 31, 2025. To put that into perspective, Village Super Market, Inc.'s trailing twelve-month revenue for fiscal year 2025 was $2.32 billion. This massive disparity in scale means Village Super Market, Inc. cannot compete on the same cost structure or national advertising spend as these giants.
The rivalry is further intensified by the presence of other significant players. Kroger, cited as the nation's largest pure-play supermarket chain last year, posted annual revenue of $150 billion. Regionally, a peer like Weis Markets posted trailing twelve-month revenue of $4.90 Billion USD in 2025. This landscape forces Village Super Market, Inc. into a highly fragmented environment where price sensitivity is high.
This fragmentation drives aggressive price competition and promotional spending, which directly pressures margins. For instance, in the fourth quarter of fiscal 2025, Village Super Market, Inc.'s gross profit fell 0.5% to $168.9 million, with higher promotional spending cited as a factor impacting margins. You see this pressure reflected in the need for constant strategic investment just to keep pace.
Here's a quick look at the revenue scale difference as of late 2025:
| Company | Latest Reported Revenue Figure (Approximate) | Data Context |
|---|---|---|
| Walmart (U.S. Grocery) | $276 billion | FY 2025 (Year ended Jan 31, 2025) |
| Kroger (Annual Revenue Context) | $150 billion | Last Year Context |
| Weis Markets (WMK) | $4.90 Billion USD | 2025 Trailing Twelve Months (TTM) |
| Village Super Market, Inc. (VLGEA) | $2.32 billion | Fiscal Year 2025 (TTM ending Jul 26, 2025) |
To combat the competitive erosion and drive necessary top-line growth in this tough setting, a store replacement and remodel strategy is a constant necessity. This capital-intensive approach aims to refresh the customer experience and increase basket size. The results of these efforts are tracked closely through same-store sales growth (SSS). For the third quarter of fiscal 2025, Village Super Market, Inc. reported same-store sales growth of 1.9%. The full-year 2025 SSS growth was reported at 2.2%.
The capital deployed for these initiatives is substantial, as seen by the strategic focus on upgrading locations. The company is actively replacing older, smaller formats with newer, larger stores, such as replacing a 44,000 square foot store with a 72,000 square foot one in a 2025 remodel. This investment is critical to maintaining relevance against competitors who are also heavily investing in their physical and digital footprints, as evidenced by Kroger's Q2 2025 identical sales growth of 3.4% (excluding fuel).
The key actions Village Super Market, Inc. is taking to manage this rivalry include:
- Driving sales through physical upgrades, like the new 72,000 sq. ft. Watchung, NJ replacement store.
- Focusing on digital sales, which surged 10% in Q3 2025.
- Leveraging the Wakefern cooperative for purchasing scale and rebates to offset cost pressures.
- Maintaining a consistent capital expenditure program, with plans for a $75 million budget in fiscal 2026 for further replacement and remodeling projects.
The pressure is constant; if onboarding takes 14+ days, churn risk rises.
Finance: draft 13-week cash view by Friday.
Village Super Market, Inc. (VLGEA) - Porter's Five Forces: Threat of substitutes
You're looking at the competitive landscape for Village Super Market, Inc. (VLGEA) as we move through late 2025, and the threat from substitutes is definitely a major factor. A substitute product offers a similar benefit but comes from outside the traditional supermarket industry. For VLGEA, which operates 34 supermarkets under the ShopRite and Fairway banners plus three Gourmet Garage specialty markets, this threat is multifaceted.
Non-traditional food sources like meal-kit services and quick-service restaurants (QSRs) are growing substitutes. These options directly compete for the consumer's food dollar by offering convenience that bypasses the need for a full grocery trip. While I don't have the precise 2025 market penetration figures for every meal-kit service, the industry trend shows consumers are increasingly valuing time over traditional shopping trips for specific meal solutions. QSRs, meanwhile, continue to capture significant spending on prepared meals.
The most quantifiable substitute threat comes from mass merchants and discounters, particularly Walmart. Walmart remains the undisputed leader in U.S. grocery retail, commanding an estimated 21.2 percent market share in 2025. This scale allows them to offer cheaper alternatives for packaged and household goods, putting a hard ceiling on the shelf prices VLGEA can command for those staple items. You can see the sheer scale difference when you map it out:
| Metric | Village Super Market, Inc. (VLGEA) (FY2025 Est.) | Walmart U.S. Grocery (FY2025) |
|---|---|---|
| Total Revenue (TTM/Annual) | $2.32 billion | N/A (U.S. Grocery Sales: $276 billion) |
| U.S. Grocery Market Share | Regional/Co-op Member | 21.2 percent |
| Overall U.S. Retail Market Share | N/A | 6.04 percent |
| Consumer Preference Ranking (2025 Poll) | N/A | Ranked #1 by 63.3% of Americans |
VLGEA counters this intense, low-price pressure by leaning into areas where the mass merchants historically struggle to match quality or immediacy. They focus on high-margin prepared foods and specialty departments. This strategy shifts the value proposition from pure price competition on staples to offering superior quality, freshness, and convenience in ready-to-eat and specialty categories. The success of this pivot is reflected in their digital growth, which is a key channel for capturing the convenience-seeking customer who might otherwise go to a QSR or meal-kit service.
Here's how VLGEA is using its internal strengths to manage the substitute threat:
- Focus on high-margin prepared foods and deli services.
- Leverage the ShopRite Price Plus and Fairway Insider loyalty programs.
- Achieved same store digital sales growth of 10% in Q3 FY2025.
- Maintained a Gross Profit Margin of 28.57% in fiscal 2025.
- Operate three Gourmet Garage specialty markets in New York City.
The gross margin, which was 28.57% in fiscal 2025, shows they are successfully protecting profitability despite the competitive environment. Finance: draft 13-week cash view by Friday.
Village Super Market, Inc. (VLGEA) - Porter's Five Forces: Threat of new entrants
You're looking at the barriers to entry for a new grocery player trying to set up shop against Village Super Market, Inc. in its established markets. Honestly, the hurdles are substantial, built on capital demands, cooperative power, and real estate scarcity.
High Capital Expenditure as a Barrier
Starting a large-format supermarket today demands serious upfront cash. Village Super Market, Inc. itself budgeted \$75 million in capital expenditures for Fiscal Year 2025. That figure was earmarked specifically for replacement store locations, such as the ones planned for East Orange, NJ, and Watchung, NJ. Imagine the capital a brand-new entrant would need just to acquire land, build a modern facility, stock it, and cover initial operating losses before seeing a dime of revenue. That kind of initial outlay immediately filters out most potential competitors.
The Wakefern Cooperative Advantage
Village Super Market, Inc.'s membership in Wakefern Food Corporation creates a massive, nearly insurmountable cost and distribution advantage that a new entrant would struggle to replicate. Wakefern is the largest retailer-owned food cooperative in the United States. This membership grants Village Super Market, Inc. access to economies of scale in purchasing, distribution, advanced retail technology, marketing, and advertising that rival much larger chains. Consider the scale:
| Wakefern Metric | Data Point |
| Estimated Annual Revenue (2025) | US$20.7 billion |
| Warehousing Footprint | Over 2.5 million square feet of grocery and non-food warehousing |
| Cooperative Members (as of 2023) | 48 member companies |
| Procurement Advantage | Best-in-class procurement practices and private label development |
A new entrant must build this entire infrastructure-procurement leverage, technology backbone, and distribution network-from scratch, which is a multi-year, multi-billion-dollar proposition. Plus, Village Super Market, Inc. benefits from patronage dividends and rebates from Wakefern, a direct cost advantage. It's tough to compete when your competitor is essentially getting a volume discount on everything they sell.
Real Estate Scarcity and Cost
Securing prime, large-format real estate in the dense northeastern markets where Village Super Market, Inc. operates-New Jersey, New York, Maryland, and Pennsylvania-is both difficult and incredibly expensive. These are mature, highly developed areas. New construction for a grocery anchor today would likely come at a significant premium; for example, some existing East Coast grocery-anchored portfolios are valued at a +/-50% premium to their replacement cost. Furthermore, Village Super Market, Inc. is actively investing in securing its future locations, such as purchasing the real estate for its Springfield, NJ store, suggesting a strategy to lock down key physical assets.
The operational efficiency required to succeed in these high-cost areas is another deterrent. Look at Village Super Market, Inc.'s FY 2025 performance:
- Sales per store: \$60,591 (Implied daily/weekly figure not specified, but high volume is key)
- Sales per average square foot (FY 2025): \$1,524
- Total FY 2025 Sales: \$2,320.69 million
Operational Efficiency and Inventory Turnover
The New Jersey market demands razor-sharp operational efficiency, especially given the perishable nature of grocery goods. The industry standard for inventory turnover for grocery stores generally falls between 10 to 15 times per year. This means a new entrant must master the logistics of selling and replacing its entire stock that frequently just to keep pace. Any lag in inventory turnover ties up working capital and increases spoilage risk, which is fatal in an industry with thin margins. Village Super Market, Inc.'s ability to generate \$1,524 in sales per square foot suggests high throughput, a level of efficiency that new, unproven local entrants would find hard to match immediately.
Disclaimer
All information, articles, and product details provided on this website are for general informational and educational purposes only. We do not claim any ownership over, nor do we intend to infringe upon, any trademarks, copyrights, logos, brand names, or other intellectual property mentioned or depicted on this site. Such intellectual property remains the property of its respective owners, and any references here are made solely for identification or informational purposes, without implying any affiliation, endorsement, or partnership.
We make no representations or warranties, express or implied, regarding the accuracy, completeness, or suitability of any content or products presented. Nothing on this website should be construed as legal, tax, investment, financial, medical, or other professional advice. In addition, no part of this site—including articles or product references—constitutes a solicitation, recommendation, endorsement, advertisement, or offer to buy or sell any securities, franchises, or other financial instruments, particularly in jurisdictions where such activity would be unlawful.
All content is of a general nature and may not address the specific circumstances of any individual or entity. It is not a substitute for professional advice or services. Any actions you take based on the information provided here are strictly at your own risk. You accept full responsibility for any decisions or outcomes arising from your use of this website and agree to release us from any liability in connection with your use of, or reliance upon, the content or products found herein.