
|
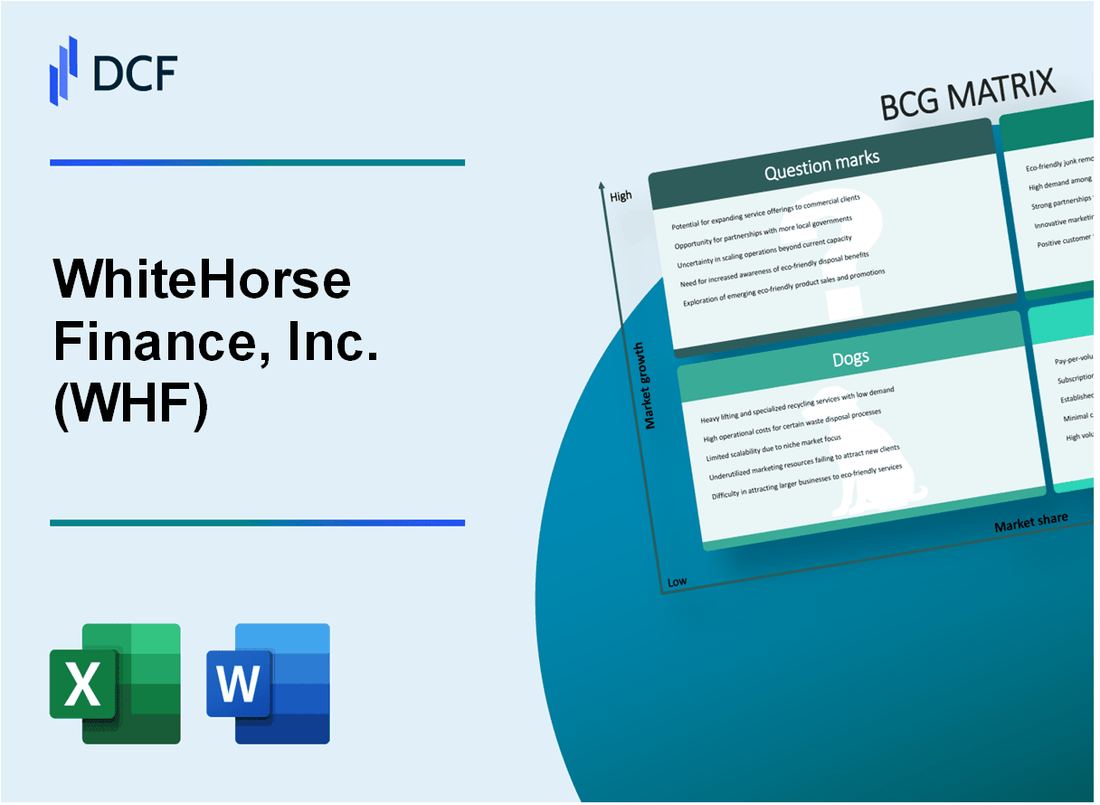
WhiteHorse Finance, Inc. (WHF): BCG Matrix [Dec-2025 Updated] |
Fully Editable: Tailor To Your Needs In Excel Or Sheets
Professional Design: Trusted, Industry-Standard Templates
Investor-Approved Valuation Models
MAC/PC Compatible, Fully Unlocked
No Expertise Is Needed; Easy To Follow
WhiteHorse Finance, Inc. (WHF) Bundle
You're looking at WhiteHorse Finance, Inc. (WHF) right now-late 2025-and the portfolio map shows a clear tension between established income and future growth challenges. We've got a burgeoning Star in that Joint Venture investment, now worth $341.5 million, sitting alongside a massive Cash Cow base of first-lien loans making up 74.7% of the book. But, honestly, the Question Marks are loud: the recent NAV drop to $11.41 per share and dividend coverage that's razor-thin, barely ahead of the $0.25 base payout. Let's break down exactly where WHF is placing its bets and where the hidden risks-like those 2.7% non-accruals-are lurking in this complex BDC structure.
Background of WhiteHorse Finance, Inc. (WHF)
You're looking at WhiteHorse Finance, Inc. (WHF), which operates as a business development company (BDC) under the Investment Company Act of 1940. Honestly, its core mission is straightforward: generate attractive risk-adjusted returns by originating senior secured loans to performing lower middle market companies across various industries. This firm is externally managed, with its investment activities overseen by H.I.G. WhiteHorse Advisers, LLC, an affiliate of H.I.G. Capital, LLC.
The investment focus targets middle-market companies, generally those with enterprise values between $50 million and $350 million, primarily through debt investments. As of the third quarter of 2025, specifically September 30, 2025, WhiteHorse Finance, Inc. maintained a diversified investment portfolio valued at fair value of $568.4 million. This portfolio was spread across 125 positions in 66 portfolio companies at that time.
Looking at the yield profile, the weighted average effective yield on income-producing debt investments stood at 11.6% as of September 30, 2025. However, the operating results for the third quarter ended September 30, 2025, showed some strain, with core and GAAP net investment income (NII) falling to $6.1 million, which translates to $0.263 per share. This compares to the $6.8 million (or $0.294 per share) reported in Q1 2025.
The Net Asset Value (NAV) per share also saw a reduction, sitting at $11.41 as of September 30, 2025, a drop from $11.82 at the end of the prior quarter. This decline was partly due to $6.7 million in net realized and unrealized losses recognized in Q3. In response to earnings pressure, the board reset the quarterly distribution to $0.25 per share for the quarter ended September 30, 2025, down from the previous $0.385 per share. To help support the distribution, the adviser voluntarily agreed to lower its incentive fee from 20.00% to 17.50% for the next two fiscal quarters.
On the leverage side, WhiteHorse Finance, Inc. maintained a relatively conservative stance, with the Net Effective Debt-to-Equity Ratio at approximately 1.07 times at the end of Q3 2025, which is down from 1.22 times in the prior quarter. A positive development noted was that non-accruals dropped to 2.7% of the debt portfolio by the end of Q3 2025. Furthermore, the board authorized a stock repurchase program to buy back up to $15.0 million of common stock, signaling management's view that the stock traded at a significant discount to book value.
WhiteHorse Finance, Inc. (WHF) - BCG Matrix: Stars
You're analyzing WhiteHorse Finance, Inc. (WHF) portfolio, and the STRS Joint Venture (JV) definitely stands out as a primary Star. Stars, as we know, are leaders in a growing segment, consuming cash to maintain market share but promising future Cash Cow status. For WhiteHorse Finance, Inc., this JV represents that high-growth, high-share investment.
The STRS Joint Venture investment is a significant asset, showing strong commitment from management to this area. As of the third quarter of 2025, the aggregate fair value of the STRS JV portfolio reached $341.5 million. This is up from $330.2 million at the end of the second quarter of 2025, showing continued capital deployment and growth in the underlying asset base.
The performance of this equity investment in the JV is what truly qualifies it as a Star. The Chief Financial Officer confirmed that the investment is generating a strong, accretive mid-teens return on equity (ROE). During the third quarter of 2025, the income recognized from this JV investment aggregated to approximately $3.6 million.
Here's a quick look at the key metrics supporting the STRS JV's Star status as of September 30, 2025:
| Metric | Value as of Q3 2025 | Comparison/Context |
| Aggregate Fair Value | $341.5 million | Up from $330.2 million in Q2 2025. |
| Average Effective Yield | 10.3% | Slightly down from 10.6% in Q2 2025. |
| Income Recognized in Q3 2025 | Approximately $3.6 million | Accretive to earnings. |
| Portfolio Companies | 43 positions | Consistent with Q2 2025. |
To capture market share in what management views as high-yield potential deals, WhiteHorse Finance, Inc. has been actively deploying capital. This strategic deployment is necessary to feed the growth of the Star segment. The company made investments in new portfolio companies and added to existing ones during the quarter.
The capital deployment activity for the third quarter ended September 30, 2025, included:
- Gross deployments totaling $19.3 million.
- Additions to existing portfolio companies of $4.9 million.
- Net fundings to revolver loans of $0.5 million.
While the outline mentions new sponsor mandates with pricing of 425 to 550 basis points over SOFR, that specific data point isn't in the latest reports. What we do see is that the overall portfolio maintained a weighted average effective yield of 11.6% on income-producing debt investments as of September 30, 2025. This yield, combined with the accretive mid-teens ROE from the JV, signals the high-return focus for new capital, even as the overall portfolio yield saw a slight dip from 11.9% in Q2 2025. The focus on new deal origination, even amidst portfolio runoff, is the action required to sustain this asset as a Star.
WhiteHorse Finance, Inc. (WHF) - BCG Matrix: Cash Cows
You're looking at the core engine of WhiteHorse Finance, Inc. (WHF) here-the assets that generate the steady, predictable cash flow necessary to fund everything else. These are the established investments in a mature lending market, commanding a high market share within their specific segments.
The foundation of this cash-generating segment is the core portfolio of first-lien senior secured loans, comprising approximately 74.7% of the portfolio at Q3 2025 fair value. This concentration in senior debt is what provides the stability we associate with a Cash Cow. As of September 30, 2025, the total investment portfolio fair value stood at $568.4 million, spread across 125 positions in 66 companies, excluding the STRS JV investment.
We see consistent interest income generation from the overall portfolio, despite a slight yield drop to 11.6% on income-producing debt in Q3 2025. That yield compares to 11.9% in Q2 2025, mainly due to lower spreads and lower base rates. Even with this dip, the asset class remains highly productive, underpinning the company's ability to meet obligations. The weighted average effective yield on the overall portfolio also decreased slightly to 9.5% at the end of Q3.
The established, large base of investments targets lower middle-market companies with enterprise values of $50 million to $350 million. WhiteHorse Finance, Inc. defines this space as its primary focus for originating senior secured loans. This focus area represents a deep, well-understood market segment where the company has built significant expertise and market presence.
The historical ability to sustain a dividend is a key indicator of Cash Cow status, even if the base distribution was recently reset to $0.25 per share for the quarter ending September 30, 2025, payable on January 5, 2026. This reset was a prudent measure to align payouts with expected earnings power given current market conditions. To support this, the Investment Adviser voluntarily agreed to reduce the incentive fee on net investment income from 20.00% to 17.50% for the next two fiscal quarters ending December 31, 2025, and March 31, 2026, respectively.
Here's a quick look at the financial context supporting this segment's role:
| Metric | Value (Q3 2025) |
| Portfolio Fair Value | $568.4 million |
| Yield on Income-Producing Debt | 11.6% |
| NAV per Share | $11.41 |
| Cash on Hand | $45.9 million |
Because these assets are mature and require less aggressive marketing or growth capital, the focus shifts to efficiency. The company announced a share repurchase program to buy back up to $15.0 million of its common stock, signaling a move to return capital to shareholders when the stock trades at a significant discount to book value.
The stability of the Cash Cow segment allows for strategic infrastructure support, which, for WhiteHorse Finance, Inc., includes managing the portfolio through challenging credits. The company is actively working through underperformers, which is a necessary investment to maintain the quality of the cash flow stream. You can see the effort in the nonaccrual improvement, which stood at 2.7% of the debt portfolio at fair value at the end of Q3, down from 4.9% in Q2.
The core function of these assets is clear:
- Generate the cash to cover administrative costs.
- Fund the necessary capital to maintain asset quality.
- Support the declared base distribution of $0.25 per share.
- Provide a buffer, as seen by the $45.9 million in cash on hand.
The Cash Cow segment is what you rely on to keep the lights on and fund the riskier Question Marks. Finance: draft 13-week cash view by Friday.
WhiteHorse Finance, Inc. (WHF) - BCG Matrix: Dogs
You're looking at the parts of WhiteHorse Finance, Inc. (WHF) that are stuck in low-growth, low-market-share territory-the classic Dogs quadrant. These are the investments that aren't consuming massive amounts of cash, but they certainly aren't generating the returns needed to justify their continued presence, often acting as cash traps tied up in underperforming credits.
The clearest indicator of this segment's drag is the non-accrual status of certain assets. As of the third quarter of 2025, non-accrual investments represented 2.7% of the total debt portfolio when measured at fair value. This is an improvement from the 4.9% reported in the prior quarter, but it still signals persistent credit quality issues that demand management focus.
To manage these specific drags, WhiteHorse Finance, Inc. (WHF) has a dedicated internal resource tied up. Legacy investments require a dedicated five-person restructuring team, which is a direct drain on management bandwidth that could be used elsewhere. Honestly, expensive turn-around plans rarely work in this quadrant, so divestiture is often the cleaner path.
The financial impact from the worst offenders in this category was significant in the third quarter of 2025. Specific underperforming credits, namely Alvaria and Camarillo Fitness, drove an aggregate total of $6.7 million in net realized and unrealized losses for the period. That $6.7 million hit directly against the net asset value.
We can map out the riskier, lower-priority areas of the portfolio here. While the core is First Lien debt, the following categories represent minimal exposure, reflecting a strategic avoidance of these higher-risk asset classes, which often fall into the Dog or Question Mark categories:
- Second-lien secured loans: 74.7% of the debt portfolio at fair value in Q3 2025.
- Subordinated debt: 0.2% of the debt portfolio at fair value in Q3 2025.
- Equity: 3.5% of the total portfolio at fair value in Q3 2025.
- Second-lien and unsecured loans: less than 1% of the portfolio, carrying higher risk.
Here's a quick look at how the portfolio composition breaks down by instrument type as of the end of Q3 2025, showing where the focus isn't:
| Instrument Type (Based on Fair Value) | Percentage of Portfolio |
| First Lien Senior Secured Loans | 74.7% |
| STRS JV Investment | 16.4% |
| Second Lien Secured Loans | 1.3% |
| Equity | 3.5% |
| Investments on Non-Accrual Status (Debt Investments) | 2.7% |
The fact that second-lien and unsecured loans constitute less than 1% of the portfolio suggests management is actively minimizing exposure to these higher-risk structures, which aligns with the strategy of avoiding new Dogs. Still, the $6.7 million in losses from just two credits shows that even small allocations to troubled assets can have a material impact on earnings and NAV per share, which fell to $11.41 in Q3 2025.
WhiteHorse Finance, Inc. (WHF) - BCG Matrix: Question Marks
You're looking at the parts of WhiteHorse Finance, Inc. that are consuming cash while trying to find their footing in a tough market, which is the classic profile of a Question Mark. These areas have high potential growth markets but currently hold a low market share, demanding heavy investment to shift their position.
The sustainability of the dividend coverage is a primary concern here. For the third quarter of 2025, WhiteHorse Finance, Inc. reported core net investment income (NII) of $0.263 per share. This figure barely covers the newly reset base distribution of $0.25 per share. The prior quarterly base distribution was $0.385 per share. This tight coverage suggests that without significant improvement in earnings power, the current payout is not fully supported by recurring NII.
A key capital allocation move signaling uncertainty is the $15.0 million stock repurchase program authorized by the board on November 10, 2025. The company noted the stock trades at a discount of more than 40% to book value, suggesting management views the shares as undervalued, but the long-term growth impact of this capital deployment remains to be seen. This action is intended to be accretive to shareholders given the discount.
New investment origination is happening in a highly competitive lending environment, which is reflected in the portfolio activity. Gross capital deployments in Q3 2025 were $19.3 million, but this was significantly offset by repayments and sales totaling $50.5 million, resulting in net repayments of $31.2 million for the quarter. Furthermore, the weighted average effective yield on income-producing debt investments dropped to 11.6% as of September 30, 2025, down from 11.9% in Q2 2025. This pressure on pricing and net deployment suggests the origination efforts are not yet yielding the necessary market share gains or returns.
The pace of Net Asset Value (NAV) recovery is another metric defining this quadrant. The NAV per share fell to $11.41 per share in Q3 2025, marking a 3.6% decrease from the prior quarter. This decline followed net realized and unrealized losses in the portfolio totaling $6.7 million, which impacted NAV by approximately $0.29 per share. The total investment portfolio fair value also decreased by $60.9 million quarter-over-quarter, ending at $568.4 million.
To manage the immediate cash flow pressure while these segments develop, WhiteHorse Finance, Inc. implemented temporary measures:
- The incentive fee on net investment income was voluntarily reduced by the Adviser from 20.00% to 17.50% for the next two fiscal quarters, ending December 31, 2025, and March 31, 2026.
- A special distribution of $0.035 per share was declared in October 2025.
Here's a quick look at the key Q3 2025 figures that frame the Question Mark status:
| Metric | Value | Context |
| Core NII per Share | $0.263 | Barely covers the new base distribution. |
| New Base Distribution | $0.25 per share | Reset from $0.385 per share. |
| NAV per Share | $11.41 | Reflects markdowns and operational pressures. |
| Share Repurchase Authorization | Up to $15.0 million | Capital allocation below current book value. |
| Net Realized/Unrealized Losses | $6.7 million | Impacted NAV by approximately $0.29 per share. |
| Total Investments (Fair Value) | $568.4 million | Decreased by $60.9 million quarter-over-quarter. |
Despite the challenges, there are developing positives that suggest potential for these units to become Stars. Non-accruals improved to 2.7% of the debt portfolio at fair value, down from 4.9% in the prior quarter. Also, the STRS JV remained accretive, generating roughly $3.6 million of income in Q3 and showing a return on equity in the mid-teens. The decision now is whether WhiteHorse Finance, Inc. invests heavily to grow market share in these areas or decides to divest.
Disclaimer
All information, articles, and product details provided on this website are for general informational and educational purposes only. We do not claim any ownership over, nor do we intend to infringe upon, any trademarks, copyrights, logos, brand names, or other intellectual property mentioned or depicted on this site. Such intellectual property remains the property of its respective owners, and any references here are made solely for identification or informational purposes, without implying any affiliation, endorsement, or partnership.
We make no representations or warranties, express or implied, regarding the accuracy, completeness, or suitability of any content or products presented. Nothing on this website should be construed as legal, tax, investment, financial, medical, or other professional advice. In addition, no part of this site—including articles or product references—constitutes a solicitation, recommendation, endorsement, advertisement, or offer to buy or sell any securities, franchises, or other financial instruments, particularly in jurisdictions where such activity would be unlawful.
All content is of a general nature and may not address the specific circumstances of any individual or entity. It is not a substitute for professional advice or services. Any actions you take based on the information provided here are strictly at your own risk. You accept full responsibility for any decisions or outcomes arising from your use of this website and agree to release us from any liability in connection with your use of, or reliance upon, the content or products found herein.