
|
WhiteHorse Finance, Inc. (WHF): 5 FORCES Analysis [Nov-2025 Updated] |
Fully Editable: Tailor To Your Needs In Excel Or Sheets
Professional Design: Trusted, Industry-Standard Templates
Investor-Approved Valuation Models
MAC/PC Compatible, Fully Unlocked
No Expertise Is Needed; Easy To Follow
WhiteHorse Finance, Inc. (WHF) Bundle
You're digging into the core structure of WhiteHorse Finance, Inc., and frankly, the competitive reality for this direct lender as of late 2025 is a mixed bag of defense and offense. Honestly, while WhiteHorse Finance, Inc. has taken steps to shore up its funding base-like completing a $298.15 million CLO securitization in June 2025 and seeing its adviser voluntarily cut the incentive fee to 17.50%-the market is pushing back hard. That high competitive rivalry is evident as loan spreads keep compressing, evidenced by the weighted average effective yield dropping to 11.6% by Q3 2025, meaning your smaller, lower middle market customers have more options, including refinancing into the broadly syndicated loan market. Still, the regulatory hurdles and the sheer scale of the H.I.G. Capital platform act as a defintely strong barrier, keeping the threat of brand-new entrants somewhat in check for now.
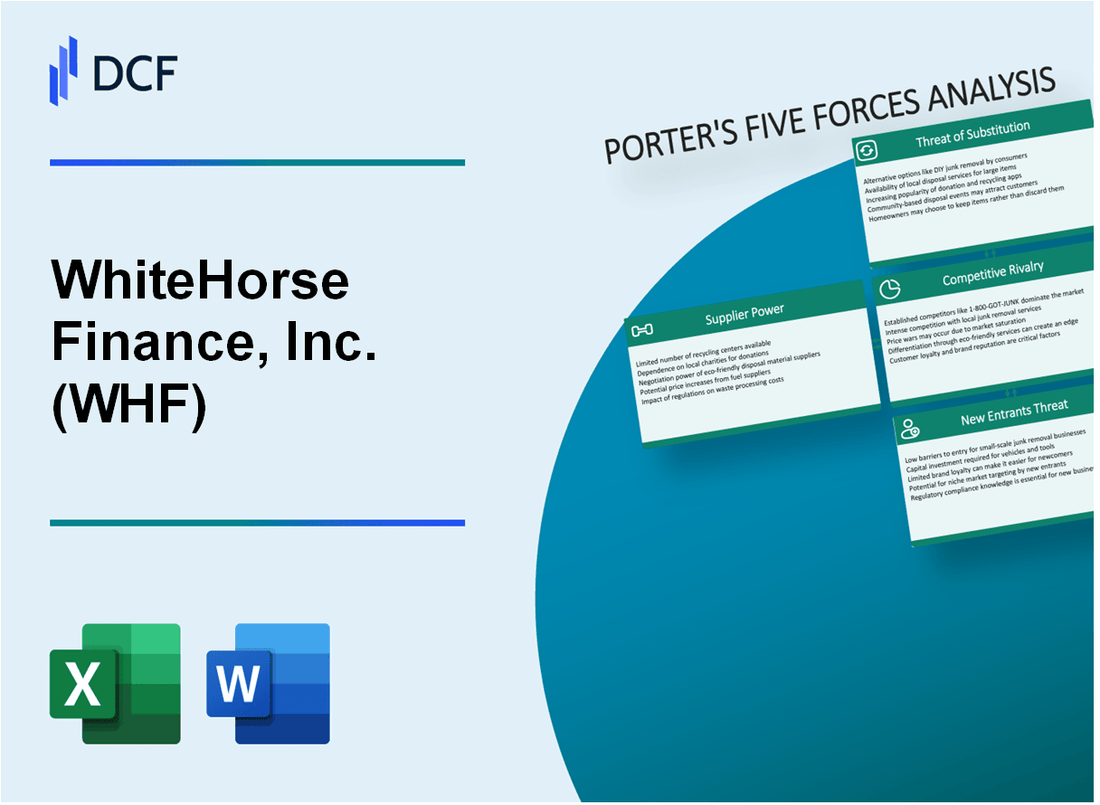
WhiteHorse Finance, Inc. (WHF) - Porter's Five Forces: Bargaining power of suppliers
When you look at WhiteHorse Finance, Inc. (WHF), the primary suppliers aren't raw material vendors; they are the providers of capital-banks, debt investors, and equity holders. Honestly, their power is best described as moderate, but it's a dynamic that WhiteHorse Finance actively manages through its structure and recent actions.
The company has taken clear steps to manage this, particularly with its debt stack. For instance, in June 2025, WhiteHorse Finance completed a significant $298.15 million CLO term debt securitization transaction. This move is a classic way to diversify funding sources away from relying too heavily on any single bank or credit facility, thereby keeping supplier power in check. The fact that $174.0 million of this was issued through a private placement shows a direct effort to tap different investor pools.
To give you a clearer picture of the funding landscape as of mid-2025, here is a snapshot of their debt and key funding relationships:
| Funding Source/Metric | Value as of Q2 2025 (June 30, 2025) | Context/Date |
|---|---|---|
| Total CLO Term Debt Securitization | $298.15 million | Completed June 2025 |
| Revolving Credit Facility Outstanding Debt | $174.00 million | As of June 30, 2025 |
| STRS Joint Venture (JV) Total Assets | $351.0 million | As of June 30, 2025 |
| Return on Investment in STRS JV | 14.0% | Q2 2025 |
| Expected Interest Cost Savings from CLO | $0.01-$0.015 per share per quarter | Management expectation post-CLO |
The STRS Joint Venture (JV) with the State Teachers Retirement System of Ohio (STRS) is a major component of this, representing $351.0 million in total assets as of June 30, 2025. This JV is a key strategic partner, and its strong return of 14.0% in Q2 2025 makes it a highly valued, though powerful, funding relationship for WhiteHorse Finance, Inc.
Now, let's pivot to the equity side of the capital equation. As a Business Development Company (BDC), WhiteHorse Finance, Inc. operates under a structure that inherently shifts leverage toward shareholders, which is a form of supplier power. The mandate is to distribute most of its taxable income.
Here's what that shareholder leverage looks like in concrete terms:
- The TTM dividend payout as of November 24, 2025, stood at $1.54 per share.
- The annual dividend is reported as $1.79 per share, translating to a yield of 24.90%.
- For the third quarter of 2025, the declared distribution was $0.25 per share, payable on January 5, 2026.
- The base management fee is set at 2%, but the incentive fee structure is where the real negotiation happens.
This pressure from shareholders to maintain distributions is directly reflected in the actions taken by the Investment Adviser. In November 2025, WhiteHorse Advisers voluntarily agreed to waive and reduce the incentive fee on net investment income from its standard annual rate of 20.00% down to 17.50%. This temporary reduction covers two fiscal quarters, ending December 31, 2025, and March 31, 2026, respectively. This move clearly demonstrates the adviser yielding to the board's-and ultimately, the shareholders'-desire for better dividend coverage and capital retention, showing where the real power lies in the BDC model.
WhiteHorse Finance, Inc. (WHF) - Porter's Five Forces: Bargaining power of customers
When you look at WhiteHorse Finance, Inc. (WHF)'s customer base-the companies they lend to-you see a distinct profile that shapes their negotiating position. These aren't the massive, publicly traded firms; these are the engines of the economy, the lower middle market companies. Honestly, this focus is key to understanding their customer power dynamic.
The target customer for WhiteHorse Finance, Inc. is clearly defined by enterprise value. They principally focus on originating senior secured loans to performing lower middle market companies with enterprise values generally between $50 million and $350 million as of their Q3 2025 reporting. This segment often relies heavily on private credit because they may not meet the size thresholds or risk profile for the broadly syndicated loan market, which tends to favor larger borrowers.
The power of any single borrower to dictate terms is significantly diluted by WhiteHorse Finance, Inc.'s portfolio construction. As of September 30, 2025, the investment portfolio, valued at $568.4 million fair value, was spread across 66 different portfolio companies. This high level of diversification means that the default or aggressive negotiation of one borrower has a minimal impact on the overall financial health of WhiteHorse Finance, Inc. It's a classic risk-mitigation strategy that inherently lowers customer bargaining power.
Here's a quick look at how the portfolio composition has trended, showing the consistent strategy of spreading risk:
| Metric | Q3 2025 (Sept 30) | Q4 2024 (Dec 31) | Q1 2025 (Mar 31) |
|---|---|---|---|
| Portfolio Fair Value | $568.4 million | $642.2 million | $651.0 million |
| Number of Companies | 66 | 71 | 74 |
| Average Debt Investment Size (Excl. STRS JV) | $5.2 million | $5.5 million | $5.2 million |
The small average investment size reinforces the idea that most customers are price takers rather than price setters. For the period ending September 30, 2025, the average debt investment size, excluding the STRS JV, stood at $5.2 million. When your typical check size is this small relative to the total portfolio and the overall market, you have less leverage in negotiating the spread or covenants; you are generally accepting the terms WhiteHorse Finance, Inc. brings to the table.
Still, you can't ignore the competitive landscape. The direct lending market is not a monopoly, and customers definitely have alternatives, which puts some upward pressure on WhiteHorse Finance, Inc.'s ability to demand the absolute best terms. You see this dynamic play out:
- Mega-funds and banks often focus on larger deals, leaving the lower middle market to a 'less crowded field of private lenders.'
- Competition for deals in the core and lower middle markets can lead to 'pricing and credit documentation pressure' for smaller capital providers.
- For the lower middle market, leverage multiples remain relatively consistent, suggesting that while competition exists, the underwriting discipline WhiteHorse Finance, Inc. employs (e.g., LTVs consistently 55% or less) provides a strong counterpoint to borrower demands.
The existence of other private lenders means WhiteHorse Finance, Inc. must maintain its competitive edge through deal sourcing and underwriting rigor, rather than relying solely on a captive customer base. It's a balancing act; the customer size keeps individual power low, but market alternatives prevent WhiteHorse Finance, Inc. from having unchecked pricing power.
WhiteHorse Finance, Inc. (WHF) - Porter's Five Forces: Competitive rivalry
The direct lending space remains crowded, putting pressure on WhiteHorse Finance, Inc. (WHF). You see this rivalry reflected in the yields across the industry. For instance, Saratoga Investment Corp. reported a weighted average interest rate on its core BDC portfolio of 11.5% as of its fiscal Q4 2025 end. Also, PennantPark Investment Corporation's adviser manages $9.8 billion of investable capital, showing the scale of capital competing for deals.
Market conditions are definitely showing spread compression, which is a direct result of this intense competition. WhiteHorse Finance, Inc. saw its weighted average effective yield on income-producing debt investments drop to 11.6% as of the end of Q3 2025, down from 11.9% in Q2 2025. The overall portfolio yield also softened to 9.5% from approximately 9.8% the prior quarter.
The pipeline data from the Q3 2025 call suggests near-term caution. WhiteHorse Finance, Inc. stated its pipeline remains lower than normal for that time of year. At that point, the pipeline consisted of 6 new mandates in total, broken down as:
- 2 nonsponsor deals
- 4 sponsor deals
To combat this, WhiteHorse Finance, Inc.'s strategy leans into the less-crowded segments for better risk-adjusted returns. The ownership mix in the portfolio as of September 30, 2025, shows a deliberate balance:
| Portfolio Segment | Percentage of Ownership Mix (Q3 2025) |
| Sponsor | 65% |
| Nonsponsor | 35% |
This focus on the non-sponsor market is key, especially since the deals originated in Q3 2025 reflected this strategy. All Q3 deals were first lien loans, coming in at an average spread of 612 basis points. Still, the overall portfolio composition as of September 30, 2025, remained heavily weighted toward senior secured assets:
| Investment Type (Debt Portfolio Fair Value) | Percentage |
| First Lien Secured Loans | 74.7% |
| Second Lien Secured Loans | 0.6% |
| Unsecured Loans | 0.2% |
| Equity | 5.9% |
| Investments in STRS JV | 18.6% |
Even with competitive pressure driving yields down, WhiteHorse Finance, Inc.'s Q3 2025 weighted average effective yield on income-producing debt investments was 11.6%. This figure, while lower than Q2's 11.9%, still represents a profitable lending environment, though one requiring more selective underwriting.
WhiteHorse Finance, Inc. (WHF) - Porter's Five Forces: Threat of substitutes
The threat of substitutes for WhiteHorse Finance, Inc. (WHF) remains moderate. This assessment hinges on the fact that traditional commercial banks rarely serve the lower middle market segment where WhiteHorse Finance, Inc. concentrates its lending efforts, typically targeting companies with individual enterprise values generally between $50MM and $350MM.
For larger borrowers, substitutes like high-yield bonds and syndicated loans become more viable alternatives. To put this in context, the direct lending market, which includes WhiteHorse Finance, Inc.'s primary activity, has grown to represent approximately 20% of the total leveraged finance market as of early 2025. The broader private credit market is projected to continue its expansion, potentially reaching toward $2.3 trillion in total assets by 2027.
Customers with debt from WhiteHorse Finance, Inc. can seek to refinance with other direct lenders once any initial prepayment penalties expire. This dynamic is always present in the private credit space. We saw portfolio activity in the third quarter of 2025 where WhiteHorse Finance, Inc. fully repaid the $40.0 million 5.375% 2025 Notes on September 29, 2025, which were scheduled to mature on October 20, 2025. This type of refinancing activity, whether by repayment or refinancing elsewhere, is a constant consideration.
Private equity groups are increasingly employing debt-for-equity swaps or other structured financing tools as a substitute financing mechanism, especially when traditional debt markets are tight or valuations shift. While M&A deal volume was flat year-over-year as of September 2025, overall deal value was rising, driven by larger transactions. The average EBITDA multiple for US buyouts reached 12.1x in the first half of 2025. Alternative strategies, including structured equity, remain central for private equity firms.
Here's a quick look at WhiteHorse Finance, Inc.'s key financial positioning as of the end of the third quarter of 2025, which informs its competitive standing:
| Metric | Value as of September 30, 2025 | Value as of June 30, 2025 |
|---|---|---|
| Portfolio Fair Value (USD) | $568.4 million | $629.3 million |
| Number of Portfolio Positions | 125 | 132 |
| Weighted Average Effective Yield (Income-Producing Debt) | 11.6% | 11.9% |
| Net Investment Income (NII) per Share | $0.263 | $0.282 per share |
| Net Asset Value (NAV) per Share | $11.41 | $11.82 per share |
The competitive landscape within the direct lending sector itself also influences this threat, as evidenced by WhiteHorse Finance, Inc.'s internal adjustments:
- Non-accruals dropped to 2.7% of the debt portfolio as of Q3 2025.
- The investment adviser voluntarily reduced the incentive fee from 20.00% to 17.50% for the fiscal quarters ending December 31, 2025, and March 31, 2026.
- The board approved a share repurchase program up to $15.0 million.
WhiteHorse Finance, Inc. (WHF) - Porter's Five Forces: Threat of new entrants
Honestly, you're looking at a threat of new entrants that sits firmly in the low-to-moderate range for WhiteHorse Finance, Inc. (WHF). This isn't an industry where someone can just decide to start up next Tuesday; the barriers to entry are substantial, built on layers of regulation and the sheer amount of capital required to compete effectively in the middle-market direct lending space.
The primary hurdle is the regulatory structure. WhiteHorse Finance, Inc. operates as a Business Development Company (BDC), which means it is subject to the Investment Company Act of 1940. If WHF were to fail to maintain its BDC status, it would fall under the regulations for a closed-end investment company under the 1940 Act, which imposes substantially more operating restrictions, severely limiting flexibility. New entrants must immediately commit to this complex compliance regime from day one.
The scale advantage WhiteHorse Finance, Inc. benefits from, thanks to its external manager, is a massive deterrent. H.I.G. Capital, the affiliate managing WHF, commands a platform with over $70 billion in Assets Under Management (AUM). That kind of scale translates directly into sourcing power, operational efficiency, and the ability to absorb compliance costs that would crush a smaller startup. You can see the scale difference when comparing the manager's platform to WHF's own portfolio size.
| Metric | Value (as of late 2025) | Context |
|---|---|---|
| H.I.G. Capital AUM | $70 Billion | Platform Scale Advantage |
| WHF Portfolio Fair Value | $568.4 Million | As of September 30, 2025 |
| Recent CLO Securitization Size | $298.15 Million | Executed in June 2025 |
| WHF Gross Leverage | 1.34x | As of Q2 2025 |
Furthermore, to grow and fund investments at a competitive level, new entrants must be prepared to establish sophisticated funding vehicles. It's not enough to just raise equity; you need access to leverage. WhiteHorse Finance, Inc., for example, recently completed a $298.15 million CLO term debt securitization in June 2025. Successfully executing a private placement of AAA-rated Class A Notes and subordinated notes requires deep relationships with institutional debt capital markets, which takes years to build.
The barriers to entry boil down to a few key areas you need to clear:
- Complying with the Investment Company Act of 1940.
- Securing access to large-scale, diversified credit facilities.
- Establishing complex securitization capabilities, like CLOs.
- Matching the deal flow sourcing power of established managers like H.I.G. Capital.
The market itself is signaling that scale matters, as BDC mergers and direct lending partnerships are seen as attractive ways to enhance capital access in 2025. New entrants face a steep climb to achieve the necessary operational and capital structure sophistication that WhiteHorse Finance, Inc. already possesses.
Disclaimer
All information, articles, and product details provided on this website are for general informational and educational purposes only. We do not claim any ownership over, nor do we intend to infringe upon, any trademarks, copyrights, logos, brand names, or other intellectual property mentioned or depicted on this site. Such intellectual property remains the property of its respective owners, and any references here are made solely for identification or informational purposes, without implying any affiliation, endorsement, or partnership.
We make no representations or warranties, express or implied, regarding the accuracy, completeness, or suitability of any content or products presented. Nothing on this website should be construed as legal, tax, investment, financial, medical, or other professional advice. In addition, no part of this site—including articles or product references—constitutes a solicitation, recommendation, endorsement, advertisement, or offer to buy or sell any securities, franchises, or other financial instruments, particularly in jurisdictions where such activity would be unlawful.
All content is of a general nature and may not address the specific circumstances of any individual or entity. It is not a substitute for professional advice or services. Any actions you take based on the information provided here are strictly at your own risk. You accept full responsibility for any decisions or outcomes arising from your use of this website and agree to release us from any liability in connection with your use of, or reliance upon, the content or products found herein.