
|
Fujian Sunner Development Co., Ltd. (002299.SZ) Avaliação DCF |
Totalmente Editável: Adapte-Se Às Suas Necessidades No Excel Ou Planilhas
Design Profissional: Modelos Confiáveis E Padrão Da Indústria
Pré-Construídos Para Uso Rápido E Eficiente
Compatível com MAC/PC, totalmente desbloqueado
Não É Necessária Experiência; Fácil De Seguir
Fujian Sunner Development Co., Ltd. (002299.SZ) Bundle
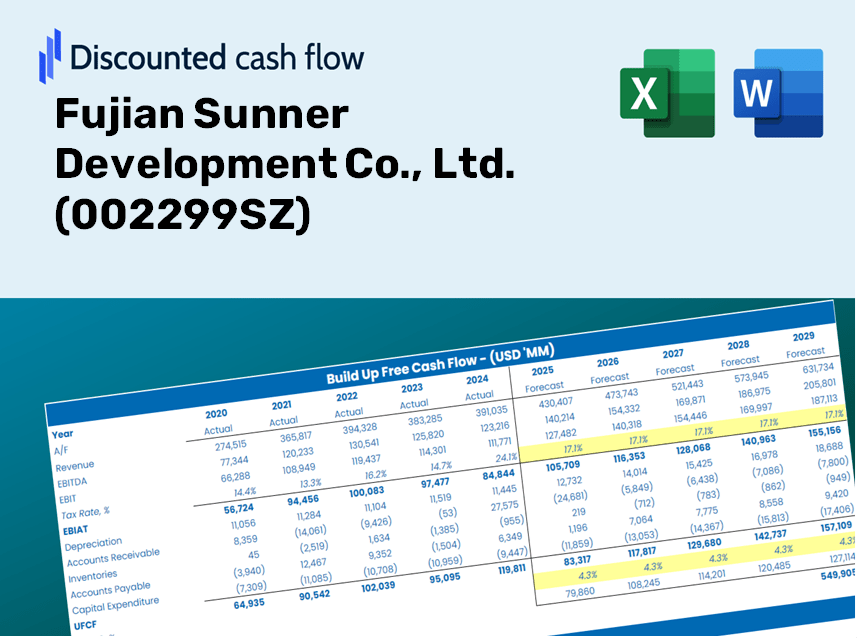
Projetado para precisão, nossa calculadora DCF (002299SZ) permite avaliar a Fujian Sunner Development Co., Ltd. Avaliação usando dados financeiros do mundo real, oferecendo flexibilidade completa para modificar todos os parâmetros essenciais para projeções aprimoradas.
What You Will Receive
- Genuine 002299SZ Financial Data: Pre-loaded with Fujian Sunner Development Co., Ltd.'s historical and forecasted data for accurate analysis.
- Fully Customizable Template: Easily adjust essential inputs such as revenue growth, WACC, and EBITDA percentage.
- Real-Time Calculations: Instantly view updates to Fujian Sunner's intrinsic value as you modify inputs.
- Comprehensive Valuation Tool: Tailored for investors, analysts, and consultants aiming for precise DCF valuations.
- Intuitive Design: Clear layout and straightforward instructions suitable for users of all skill levels.
Key Features of Fujian Sunner Development Co., Ltd. (002299SZ)
- Customizable Forecast Inputs: Adjust essential parameters such as sales growth, profit margins, and investment costs.
- Instant DCF Valuation: Provides immediate calculations of intrinsic value, net present value (NPV), and additional metrics.
- High-Precision Accuracy: Leverages Fujian Sunner's actual financial data to deliver realistic valuation results.
- Simplified Scenario Analysis: Easily explore various assumptions and compare results without hassle.
- Efficiency-Enhancing Tool: Avoid the complexities of creating valuation models from the ground up.
Process Overview
- 1. Access the Template: Download and open the Excel file containing Fujian Sunner Development Co., Ltd.'s (002299SZ) preloaded data.
- 2. Modify Assumptions: Adjust key variables such as growth projections, discount rates, and capital expenditures.
- 3. Instantly View Results: The DCF model will automatically compute the intrinsic value and NPV.
- 4. Experiment with Scenarios: Evaluate various forecasts to explore different valuation results.
- 5. Present with Assurance: Deliver professional valuation analyses to back your investment decisions.
Why Choose This Calculator for Fujian Sunner Development Co., Ltd. (002299SZ)?
- All-in-One Solution: Offers comprehensive analyses including DCF, WACC, and key financial ratios.
- Flexible Inputs: Modify the highlighted yellow cells to explore various financial scenarios.
- In-Depth Analysis: Automatically computes the intrinsic value and Net Present Value for Fujian Sunner Development.
- Included Data: Access to both historical and projected data for a solid analytical foundation.
- High-Quality Standards: Perfect for financial professionals, investors, and business advisors.
Who Can Benefit from This Product?
- Investors: Evaluate Fujian Sunner Development Co., Ltd.’s valuation prior to trading shares.
- CFOs and Financial Analysts: Enhance valuation workflows and assess financial forecasts.
- Startup Founders: Understand the valuation methods used for major public firms like Fujian Sunner Development (002299SZ).
- Consultants: Provide expert valuation analyses and reports for your clients.
- Students and Educators: Utilize real market data to learn and teach valuation strategies.
Contents of the Template
- Detailed DCF Model: An editable template featuring comprehensive valuation calculations.
- Real-Time Data: Fujian Sunner Development Co., Ltd.’s historical and projected financials are preloaded for analysis.
- Adjustable Parameters: Modify WACC, growth rates, and tax assumptions to evaluate different scenarios.
- Complete Financial Statements: Annual and quarterly breakdowns for enhanced insights.
- Essential Ratios: In-built analysis of profitability, efficiency, and leverage metrics.
- Dashboard with Visual Outputs: Includes charts and tables for straightforward, actionable insights.
Disclaimer
All information, articles, and product details provided on this website are for general informational and educational purposes only. We do not claim any ownership over, nor do we intend to infringe upon, any trademarks, copyrights, logos, brand names, or other intellectual property mentioned or depicted on this site. Such intellectual property remains the property of its respective owners, and any references here are made solely for identification or informational purposes, without implying any affiliation, endorsement, or partnership.
We make no representations or warranties, express or implied, regarding the accuracy, completeness, or suitability of any content or products presented. Nothing on this website should be construed as legal, tax, investment, financial, medical, or other professional advice. In addition, no part of this site—including articles or product references—constitutes a solicitation, recommendation, endorsement, advertisement, or offer to buy or sell any securities, franchises, or other financial instruments, particularly in jurisdictions where such activity would be unlawful.
All content is of a general nature and may not address the specific circumstances of any individual or entity. It is not a substitute for professional advice or services. Any actions you take based on the information provided here are strictly at your own risk. You accept full responsibility for any decisions or outcomes arising from your use of this website and agree to release us from any liability in connection with your use of, or reliance upon, the content or products found herein.