
|
Jiangsu Yanghe Brewery Joint-Stoque Co., Ltd. (002304.sz) Avaliação DCF |
Totalmente Editável: Adapte-Se Às Suas Necessidades No Excel Ou Planilhas
Design Profissional: Modelos Confiáveis E Padrão Da Indústria
Pré-Construídos Para Uso Rápido E Eficiente
Compatível com MAC/PC, totalmente desbloqueado
Não É Necessária Experiência; Fácil De Seguir
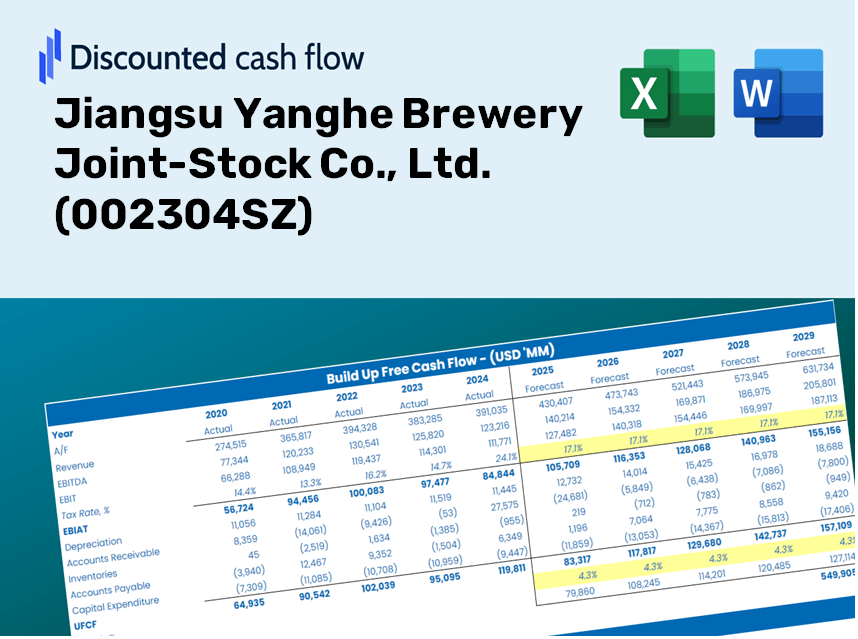
Jiangsu Yanghe Brewery Joint-Stock Co., Ltd. (002304.SZ) Bundle
Simplifique a Jiangsu Yanghe Brewery Joint-Stoque Co., Ltd. Avaliação com esta calculadora DCF personalizável! Apresentando a Real Jiangsu Yanghe Brewery Joint-Stock Co., Ltd. Financeiras e insumos de previsão ajustável, você pode testar cenários e descobrir Jiangsu Yanghe Brewery Joint-S-S-Stock Co., Ltd. Valor justo em minutos.
What You'll Receive
- Flexible Forecast Inputs: Adjust key metrics (growth %, profit margins, WACC) effortlessly to explore different scenarios.
- Relevant Financial Data: Pre-loaded financials from Jiangsu Yanghe Brewery (002304SZ) to enhance your analysis.
- Automated DCF Calculations: The template computes Net Present Value (NPV) and intrinsic value for you automatically.
- Professional and Customizable: A sophisticated Excel model that can be tailored to suit your valuation requirements.
- Designed for Analysts and Investors: Perfect for evaluating projections, confirming strategies, and maximizing efficiency.
Key Features
- Comprehensive DCF Calculator: Features detailed unlevered and levered DCF valuation models tailored for Jiangsu Yanghe Brewery Joint-Stock Co., Ltd. (002304SZ).
- WACC Calculator: A pre-built Weighted Average Cost of Capital sheet with adjustable inputs for accurate assessments.
- Customizable Forecast Assumptions: Adjust growth rates, capital expenditures, and discount rates to fit your analysis needs.
- Integrated Financial Ratios: Evaluate profitability, leverage, and efficiency ratios specific to Jiangsu Yanghe Brewery Joint-Stock Co., Ltd. (002304SZ).
- Interactive Dashboard and Charts: Visual representations summarize essential valuation metrics for straightforward analysis.
How It Works
- Step 1: Download the Excel template.
- Step 2: Examine the pre-filled financial data and projections for Jiangsu Yanghe Brewery Joint-Stock Co., Ltd. (002304SZ).
- Step 3: Adjust key inputs such as revenue growth, WACC, and tax rates (highlighted cells).
- Step 4: Observe the DCF model refresh in real-time as you modify your assumptions.
- Step 5: Evaluate the results and utilize them for your investment analysis.
Why Choose This Calculator for Jiangsu Yanghe Brewery (002304SZ)?
- User-Friendly Interface: Tailored for both novice and seasoned users.
- Customizable Inputs: Easily adjust parameters to suit your financial analysis.
- Real-Time Valuation Updates: Watch as Jiangsu Yanghe Brewery's valuation changes with your input modifications.
- Preloaded Data: Comes equipped with the latest financial figures for Jiangsu Yanghe Brewery for immediate insights.
- Preferred by Industry Experts: Favored by investors and financial analysts for informed decision-making.
Who Should Use This Product?
- Individual Investors: Make informed decisions about buying or selling shares of Jiangsu Yanghe Brewery Joint-Stock Co., Ltd. (002304SZ).
- Financial Analysts: Enhance valuation processes with pre-prepared financial models specific to Jiangsu Yanghe Brewery (002304SZ).
- Consultants: Provide clients with accurate and timely valuation insights for Jiangsu Yanghe Brewery (002304SZ).
- Business Owners: Gain a deeper understanding of how major companies like Jiangsu Yanghe Brewery (002304SZ) are valued to inform your own business strategies.
- Finance Students: Study valuation methods using real data and scenarios related to Jiangsu Yanghe Brewery (002304SZ).
Contents of the Template
- Pre-Filled Data: Contains Jiangsu Yanghe Brewery's historical financials and projections.
- Discounted Cash Flow Model: An editable DCF valuation model featuring automatic calculations.
- Weighted Average Cost of Capital (WACC): A dedicated sheet for WACC calculations with customizable inputs.
- Key Financial Ratios: Evaluate Jiangsu Yanghe Brewery's profitability, efficiency, and leverage metrics.
- Customizable Inputs: Easily modify revenue growth, profit margins, and tax rates.
- Clear Dashboard: Visual charts and tables summarizing essential valuation outcomes.
Disclaimer
All information, articles, and product details provided on this website are for general informational and educational purposes only. We do not claim any ownership over, nor do we intend to infringe upon, any trademarks, copyrights, logos, brand names, or other intellectual property mentioned or depicted on this site. Such intellectual property remains the property of its respective owners, and any references here are made solely for identification or informational purposes, without implying any affiliation, endorsement, or partnership.
We make no representations or warranties, express or implied, regarding the accuracy, completeness, or suitability of any content or products presented. Nothing on this website should be construed as legal, tax, investment, financial, medical, or other professional advice. In addition, no part of this site—including articles or product references—constitutes a solicitation, recommendation, endorsement, advertisement, or offer to buy or sell any securities, franchises, or other financial instruments, particularly in jurisdictions where such activity would be unlawful.
All content is of a general nature and may not address the specific circumstances of any individual or entity. It is not a substitute for professional advice or services. Any actions you take based on the information provided here are strictly at your own risk. You accept full responsibility for any decisions or outcomes arising from your use of this website and agree to release us from any liability in connection with your use of, or reliance upon, the content or products found herein.