
|
NEW WAVE GRUPO AB (0KIZ.L) Avaliação DCF |
Totalmente Editável: Adapte-Se Às Suas Necessidades No Excel Ou Planilhas
Design Profissional: Modelos Confiáveis E Padrão Da Indústria
Pré-Construídos Para Uso Rápido E Eficiente
Compatível com MAC/PC, totalmente desbloqueado
Não É Necessária Experiência; Fácil De Seguir
New Wave Group AB (publ) (0KIZ.L) Bundle
Procurando avaliar o valor intrínseco do grupo de novas ondas AB (publ)? Nossa calculadora DCF (0kizl) integra dados do mundo real com extensos recursos de personalização, permitindo refinar suas previsões e aprimorar suas opções de investimento.
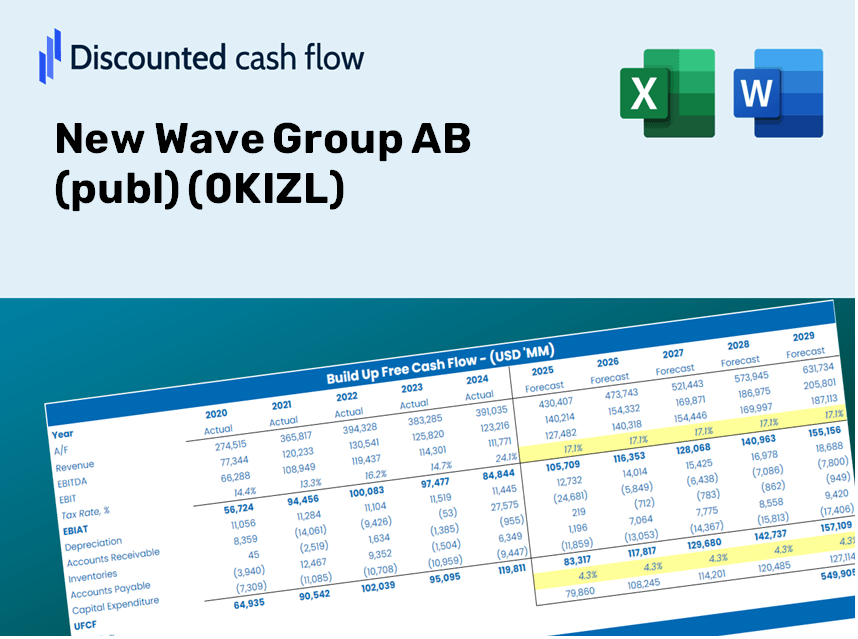
Discounted Cash Flow (DCF) - (USD MM)
| Year | AY1 2020 |
AY2 2021 |
AY3 2022 |
AY4 2023 |
AY5 2024 |
FY1 2025 |
FY2 2026 |
FY3 2027 |
FY4 2028 |
FY5 2029 |
|---|---|---|---|---|---|---|---|---|---|---|
| Revenue | 6,098.8 | 6,718.6 | 8,843.6 | 9,512.9 | 9,528.7 | 10,708.5 | 12,034.3 | 13,524.4 | 15,198.9 | 17,080.7 |
| Revenue Growth, % | 0 | 10.16 | 31.63 | 7.57 | 0.16609 | 12.38 | 12.38 | 12.38 | 12.38 | 12.38 |
| EBITDA | 791.5 | 1,236.1 | 1,755.5 | 1,846.9 | 1,588.9 | 1,870.0 | 2,101.6 | 2,361.8 | 2,654.2 | 2,982.8 |
| EBITDA, % | 12.98 | 18.4 | 19.85 | 19.41 | 16.67 | 17.46 | 17.46 | 17.46 | 17.46 | 17.46 |
| Depreciation | 243.4 | 227.3 | 249.2 | 272.3 | 318.6 | 351.2 | 394.7 | 443.5 | 498.5 | 560.2 |
| Depreciation, % | 3.99 | 3.38 | 2.82 | 2.86 | 3.34 | 3.28 | 3.28 | 3.28 | 3.28 | 3.28 |
| EBIT | 548.1 | 1,008.8 | 1,506.3 | 1,574.6 | 1,270.3 | 1,518.9 | 1,706.9 | 1,918.2 | 2,155.8 | 2,422.7 |
| EBIT, % | 8.99 | 15.02 | 17.03 | 16.55 | 13.33 | 14.18 | 14.18 | 14.18 | 14.18 | 14.18 |
| Total Cash | 325.1 | 327.9 | 419.4 | 372.6 | 545.8 | 526.8 | 592.0 | 665.3 | 747.7 | 840.3 |
| Total Cash, percent | .0 | .0 | .0 | .0 | .0 | .0 | .0 | .0 | .0 | .0 |
| Account Receivables | 1,123.5 | 1,449.3 | 1,837.2 | 1,475.2 | 1,858.2 | 2,051.2 | 2,305.2 | 2,590.6 | 2,911.4 | 3,271.8 |
| Account Receivables, % | 18.42 | 21.57 | 20.77 | 15.51 | 19.5 | 19.16 | 19.16 | 19.16 | 19.16 | 19.16 |
| Inventories | 2,883.0 | 2,937.6 | 5,297.7 | 5,346.8 | 5,124.2 | 5,587.3 | 6,279.1 | 7,056.5 | 7,930.2 | 8,912.1 |
| Inventories, % | 47.27 | 43.72 | 59.9 | 56.21 | 53.78 | 52.18 | 52.18 | 52.18 | 52.18 | 52.18 |
| Accounts Payable | 543.6 | 926.1 | 1,404.8 | 967.8 | 886.4 | 1,243.4 | 1,397.4 | 1,570.4 | 1,764.8 | 1,983.4 |
| Accounts Payable, % | 8.91 | 13.78 | 15.88 | 10.17 | 9.3 | 11.61 | 11.61 | 11.61 | 11.61 | 11.61 |
| Capital Expenditure | -56.0 | -124.1 | -134.2 | -234.9 | -309.7 | -214.2 | -240.7 | -270.5 | -304.0 | -341.7 |
| Capital Expenditure, % | -0.91821 | -1.85 | -1.52 | -2.47 | -3.25 | -2 | -2 | -2 | -2 | -2 |
| Tax Rate, % | 22.32 | 22.32 | 22.32 | 22.32 | 22.32 | 22.32 | 22.32 | 22.32 | 22.32 | 22.32 |
| EBITAT | 416.5 | 796.5 | 1,214.1 | 1,224.1 | 986.7 | 1,187.6 | 1,334.7 | 1,499.9 | 1,685.7 | 1,894.4 |
| Depreciation | ||||||||||
| Changes in Account Receivables | ||||||||||
| Changes in Inventories | ||||||||||
| Changes in Accounts Payable | ||||||||||
| Capital Expenditure | ||||||||||
| UFCF | -2,859.0 | 901.8 | -940.2 | 1,137.4 | 753.8 | 1,025.5 | 696.8 | 783.1 | 880.1 | 989.0 |
| WACC, % | 11.18 | 11.19 | 11.2 | 11.18 | 11.18 | 11.19 | 11.19 | 11.19 | 11.19 | 11.19 |
| PV UFCF | ||||||||||
| SUM PV UFCF | 3,213.6 | |||||||||
| Long Term Growth Rate, % | 2.00 | |||||||||
| Free cash flow (T + 1) | 1,009 | |||||||||
| Terminal Value | 10,982 | |||||||||
| Present Terminal Value | 6,463 | |||||||||
| Enterprise Value | 9,676 | |||||||||
| Net Debt | 1,819 | |||||||||
| Equity Value | 7,857 | |||||||||
| Diluted Shares Outstanding, MM | 265 | |||||||||
| Equity Value Per Share | 29.61 |
What You Will Receive
- Authentic NWG Financials: Access to both historical and projected data for precise valuation.
- Customizable Inputs: Adjust WACC, tax rates, revenue growth, and capital expenditures as needed.
- Real-Time Calculations: Dynamic computation of intrinsic value and NPV.
- Scenario Analysis: Explore various scenarios to assess New Wave Group AB's (0KIZL) potential performance.
- User-Friendly Design: Designed for professionals but welcoming for beginners.
Key Features
- Real-Time NWG Data: Pre-populated with New Wave Group AB's historical financial performance and future projections.
- Fully Adjustable Parameters: Tailor revenue growth, profit margins, WACC, tax rates, and capital expenditures to your preferences.
- Interactive Valuation Model: Automatically refreshes Net Present Value (NPV) and intrinsic value based on your adjustments.
- Scenario Analysis: Develop multiple forecasting scenarios to evaluate various valuation results.
- User-Centric Interface: Intuitive, organized, and suitable for both experienced professionals and newcomers.
How It Works
- Download: Obtain the pre-formatted Excel file containing New Wave Group AB's (0KIZL) financial data.
- Customize: Tailor your forecasts, including revenue growth, EBITDA %, and WACC, to suit your analysis.
- Update Automatically: Enjoy real-time updates for intrinsic value and NPV calculations as you modify inputs.
- Test Scenarios: Generate various projections and instantly compare the results for better insights.
- Make Decisions: Leverage the valuation outcomes to shape your investment strategy effectively.
Why Opt for This Calculator?
- Reliable Data: Genuine New Wave Group AB (publ) financials provide trustworthy valuation outcomes.
- Flexible Options: Tailor essential factors such as growth rates, WACC, and tax rates to align with your forecasts.
- Efficiency Boost: Ready-to-use calculations save you the hassle of building from the ground up.
- High-Quality Tool: Crafted for investors, analysts, and consultants alike.
- Accessible Interface: User-friendly design and clear, step-by-step guidance make it straightforward for anyone.
Who Can Benefit from This Product?
- Investors: Make informed investment choices with a top-notch valuation tool.
- Financial Analysts: Streamline your workflow with an easy-to-customize DCF model.
- Consultants: Adapt the template swiftly for client reports or presentations.
- Finance Enthusiasts: Enhance your knowledge of valuation practices with practical examples.
- Educators and Students: Utilize it as a hands-on resource for finance courses.
Contents of the Template
- In-Depth DCF Model: An editable template featuring extensive valuation calculations.
- Actual Financial Data: New Wave Group AB (publ)'s historical and projected financials are preloaded for your analysis.
- Adjustable Parameters: Modify WACC, growth rates, and tax assumptions to explore various scenarios.
- Comprehensive Financial Statements: Detailed annual and quarterly breakdowns for enhanced insights.
- Essential Ratios: Integrated analysis of profitability, efficiency, and financial leverage.
- Dashboard with Visual Representations: Charts and tables providing clear and actionable results.
Disclaimer
All information, articles, and product details provided on this website are for general informational and educational purposes only. We do not claim any ownership over, nor do we intend to infringe upon, any trademarks, copyrights, logos, brand names, or other intellectual property mentioned or depicted on this site. Such intellectual property remains the property of its respective owners, and any references here are made solely for identification or informational purposes, without implying any affiliation, endorsement, or partnership.
We make no representations or warranties, express or implied, regarding the accuracy, completeness, or suitability of any content or products presented. Nothing on this website should be construed as legal, tax, investment, financial, medical, or other professional advice. In addition, no part of this site—including articles or product references—constitutes a solicitation, recommendation, endorsement, advertisement, or offer to buy or sell any securities, franchises, or other financial instruments, particularly in jurisdictions where such activity would be unlawful.
All content is of a general nature and may not address the specific circumstances of any individual or entity. It is not a substitute for professional advice or services. Any actions you take based on the information provided here are strictly at your own risk. You accept full responsibility for any decisions or outcomes arising from your use of this website and agree to release us from any liability in connection with your use of, or reliance upon, the content or products found herein.