
|
Strabag SE (0mkp.l) Avaliação DCF |
Totalmente Editável: Adapte-Se Às Suas Necessidades No Excel Ou Planilhas
Design Profissional: Modelos Confiáveis E Padrão Da Indústria
Pré-Construídos Para Uso Rápido E Eficiente
Compatível com MAC/PC, totalmente desbloqueado
Não É Necessária Experiência; Fácil De Seguir
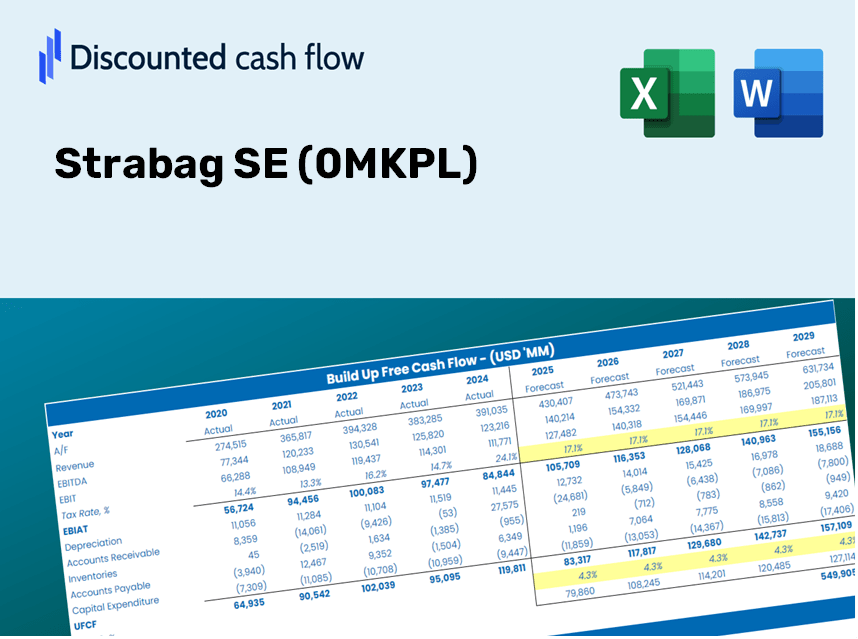
Strabag SE (0MKP.L) Bundle
Procurando determinar o valor intrínseco do Strabag SE? Nossa calculadora DCF (0MKPL) integra dados do mundo real com recursos abrangentes de personalização, permitindo refinar as previsões e aprimorar suas estratégias de investimento.
Discounted Cash Flow (DCF) - (USD MM)
| Year | AY1 2020 |
AY2 2021 |
AY3 2022 |
AY4 2023 |
AY5 2024 |
FY1 2025 |
FY2 2026 |
FY3 2027 |
FY4 2028 |
FY5 2029 |
|---|---|---|---|---|---|---|---|---|---|---|
| Revenue | 14,749.7 | 15,298.5 | 17,025.8 | 17,666.5 | 17,422.2 | 17,665.8 | 17,912.7 | 18,163.1 | 18,417.0 | 18,674.4 |
| Revenue Growth, % | 0 | 3.72 | 11.29 | 3.76 | -1.38 | 1.4 | 1.4 | 1.4 | 1.4 | 1.4 |
| EBITDA | 1,122.7 | 1,373.6 | 1,229.1 | 1,364.3 | 1,612.9 | 1,441.1 | 1,461.3 | 1,481.7 | 1,502.4 | 1,523.4 |
| EBITDA, % | 7.61 | 8.98 | 7.22 | 7.72 | 9.26 | 8.16 | 8.16 | 8.16 | 8.16 | 8.16 |
| Depreciation | 537.9 | 541.9 | 534.0 | 524.8 | 580.0 | 587.4 | 595.6 | 603.9 | 612.4 | 620.9 |
| Depreciation, % | 3.65 | 3.54 | 3.14 | 2.97 | 3.33 | 3.32 | 3.32 | 3.32 | 3.32 | 3.32 |
| EBIT | 584.8 | 831.7 | 695.2 | 839.5 | 1,032.9 | 853.8 | 865.7 | 877.8 | 890.1 | 902.5 |
| EBIT, % | 3.96 | 5.44 | 4.08 | 4.75 | 5.93 | 4.83 | 4.83 | 4.83 | 4.83 | 4.83 |
| Total Cash | 2,964.0 | 3,058.7 | 2,789.2 | 3,533.0 | 3,802.6 | 3,472.9 | 3,521.5 | 3,570.7 | 3,620.6 | 3,671.2 |
| Total Cash, percent | .0 | .0 | .0 | .0 | .0 | .0 | .0 | .0 | .0 | .0 |
| Account Receivables | 2,834.8 | 3,065.2 | 3,339.8 | 3,273.4 | 3,275.6 | 3,399.0 | 3,446.5 | 3,494.6 | 3,543.5 | 3,593.0 |
| Account Receivables, % | 19.22 | 20.04 | 19.62 | 18.53 | 18.8 | 19.24 | 19.24 | 19.24 | 19.24 | 19.24 |
| Inventories | 1,069.9 | 969.1 | 1,068.7 | 1,256.0 | 1,552.1 | 1,267.8 | 1,285.5 | 1,303.5 | 1,321.7 | 1,340.2 |
| Inventories, % | 7.25 | 6.33 | 6.28 | 7.11 | 8.91 | 7.18 | 7.18 | 7.18 | 7.18 | 7.18 |
| Accounts Payable | 2,462.8 | 2,150.7 | 2,268.7 | 2,790.8 | 2,790.8 | 2,681.5 | 2,719.0 | 2,757.0 | 2,795.5 | 2,834.6 |
| Accounts Payable, % | 16.7 | 14.06 | 13.32 | 15.8 | 16.02 | 15.18 | 15.18 | 15.18 | 15.18 | 15.18 |
| Capital Expenditure | -451.0 | -456.3 | -630.5 | -541.0 | -644.6 | -583.2 | -591.3 | -599.6 | -608.0 | -616.5 |
| Capital Expenditure, % | -3.06 | -2.98 | -3.7 | -3.06 | -3.7 | -3.3 | -3.3 | -3.3 | -3.3 | -3.3 |
| Tax Rate, % | 27.64 | 27.64 | 27.64 | 27.64 | 27.64 | 27.64 | 27.64 | 27.64 | 27.64 | 27.64 |
| EBITAT | 378.9 | 551.4 | 458.0 | 572.6 | 747.4 | 576.4 | 584.4 | 592.6 | 600.9 | 609.3 |
| Depreciation | ||||||||||
| Changes in Account Receivables | ||||||||||
| Changes in Inventories | ||||||||||
| Changes in Accounts Payable | ||||||||||
| Capital Expenditure | ||||||||||
| UFCF | -976.1 | 195.2 | 105.2 | 957.6 | 384.7 | 632.2 | 560.9 | 568.8 | 576.7 | 584.8 |
| WACC, % | 5.45 | 5.46 | 5.46 | 5.47 | 5.49 | 5.47 | 5.47 | 5.47 | 5.47 | 5.47 |
| PV UFCF | ||||||||||
| SUM PV UFCF | 2,502.7 | |||||||||
| Long Term Growth Rate, % | 2.00 | |||||||||
| Free cash flow (T + 1) | 596 | |||||||||
| Terminal Value | 17,199 | |||||||||
| Present Terminal Value | 13,180 | |||||||||
| Enterprise Value | 15,682 | |||||||||
| Net Debt | -3,309 | |||||||||
| Equity Value | 18,991 | |||||||||
| Diluted Shares Outstanding, MM | 112 | |||||||||
| Equity Value Per Share | 169.59 |
What You Will Receive
- Accurate STRABAG Financial Data: Pre-loaded with historical and forecasted data for thorough analysis.
- Completely Customizable Template: Easily adjust essential inputs such as revenue growth, WACC, and EBITDA percentage.
- Instant Calculations: Watch STRABAG’s intrinsic value refresh in real-time as you make adjustments.
- Expert Valuation Tool: Tailored for investors, analysts, and consultants aiming for precise DCF outputs.
- Intuitive Design: Straightforward layout and clear guidance suitable for all skill levels.
Key Features
- Pre-Loaded Data: Historical financial statements and pre-filled forecasts for Strabag SE (0MKPL).
- Fully Adjustable Inputs: Customize WACC, tax rates, revenue growth, and EBITDA margins.
- Instant Results: View Strabag SE’s intrinsic value recalculated in real time.
- Clear Visual Outputs: Dashboard charts present valuation results and key metrics clearly.
- Built for Accuracy: A professional tool designed for analysts, investors, and finance professionals.
How It Works
- Step 1: Download the Excel file.
- Step 2: Examine Strabag SE’s (0MKPL) pre-filled financial data and projections.
- Step 3: Adjust key inputs such as revenue growth, WACC, and tax rates (highlighted cells).
- Step 4: Observe the DCF model update in real-time as you modify your assumptions.
- Step 5: Evaluate the outputs and leverage the results for your investment strategies.
Why Choose the Strabag SE (0MKPL) Calculator?
- Precision: Accurate financial data from Strabag ensures reliable calculations.
- Adaptability: Tailored for users to easily test and adjust inputs as needed.
- Efficiency: Eliminate the tedious process of creating a DCF model from the ground up.
- Expert-Level: Crafted with the expertise and functionality expected at the CFO level.
- Intuitive Design: Simple to navigate, even for users without extensive financial modeling skills.
Who Should Use This Product?
- Investors: Accurately assess the fair value of Strabag SE (0MKPL) before making investment choices.
- CFOs: Utilize a professional-grade DCF model for comprehensive financial reporting and analysis.
- Consultants: Effortlessly modify the template to create valuation reports for clients.
- Entrepreneurs: Acquire insights into the financial modeling practices of leading companies like Strabag SE (0MKPL).
- Educators: Implement it as a teaching resource to illustrate various valuation methodologies.
Contents of the Template
- Pre-Populated Data: Features Strabag SE’s historical financial performance and projections.
- Discounted Cash Flow Model: An editable DCF valuation model with automated calculations.
- Weighted Average Cost of Capital (WACC): A separate sheet for calculating WACC using custom inputs.
- Essential Financial Ratios: Evaluate Strabag SE’s profitability, efficiency, and leverage metrics.
- Adjustable Inputs: Easily modify revenue growth rates, margins, and tax rates.
- Comprehensive Dashboard: Visualizations and tables that summarize key valuation outcomes.
Disclaimer
All information, articles, and product details provided on this website are for general informational and educational purposes only. We do not claim any ownership over, nor do we intend to infringe upon, any trademarks, copyrights, logos, brand names, or other intellectual property mentioned or depicted on this site. Such intellectual property remains the property of its respective owners, and any references here are made solely for identification or informational purposes, without implying any affiliation, endorsement, or partnership.
We make no representations or warranties, express or implied, regarding the accuracy, completeness, or suitability of any content or products presented. Nothing on this website should be construed as legal, tax, investment, financial, medical, or other professional advice. In addition, no part of this site—including articles or product references—constitutes a solicitation, recommendation, endorsement, advertisement, or offer to buy or sell any securities, franchises, or other financial instruments, particularly in jurisdictions where such activity would be unlawful.
All content is of a general nature and may not address the specific circumstances of any individual or entity. It is not a substitute for professional advice or services. Any actions you take based on the information provided here are strictly at your own risk. You accept full responsibility for any decisions or outcomes arising from your use of this website and agree to release us from any liability in connection with your use of, or reliance upon, the content or products found herein.