
|
China Tourism Group Duty Free Corporation Limited (1880.HK) Avaliação DCF |
Totalmente Editável: Adapte-Se Às Suas Necessidades No Excel Ou Planilhas
Design Profissional: Modelos Confiáveis E Padrão Da Indústria
Pré-Construídos Para Uso Rápido E Eficiente
Compatível com MAC/PC, totalmente desbloqueado
Não É Necessária Experiência; Fácil De Seguir
China Tourism Group Duty Free Corporation Limited (1880.HK) Bundle
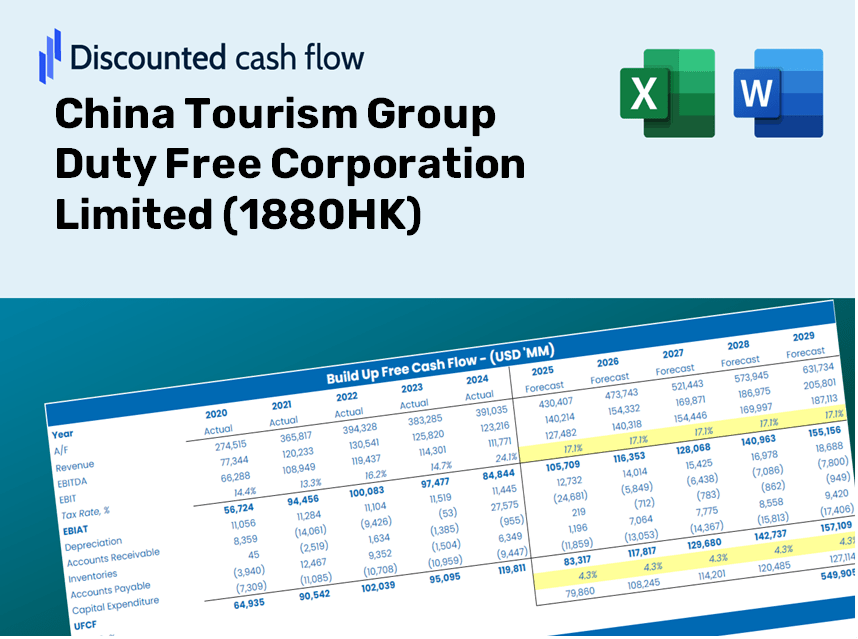
Obtenha informações sobre o seu Grupo de Turismo da China Duty Free Corporation Limited (1880HK) Análise de avaliação usando nossa calculadora DCF de última geração! Pré -carregado com dados reais (1880HK), este modelo do Excel permite ajustar as previsões e suposições para calcular com precisão o valor intrínseco do grupo de turismo da China Limited Free Corporation Limited.
Discounted Cash Flow (DCF) - (USD MM)
| Year | AY1 2020 |
AY2 2021 |
AY3 2022 |
AY4 2023 |
AY5 2024 |
FY1 2025 |
FY2 2026 |
FY3 2027 |
FY4 2028 |
FY5 2029 |
|---|---|---|---|---|---|---|---|---|---|---|
| Revenue | 57,641.4 | 74,164.9 | 59,652.4 | 74,016.6 | 61,889.1 | 64,487.4 | 67,194.8 | 70,015.8 | 72,955.3 | 76,018.1 |
| Revenue Growth, % | 0 | 28.67 | -19.57 | 24.08 | -16.38 | 4.2 | 4.2 | 4.2 | 4.2 | 4.2 |
| EBITDA | 10,961.6 | 17,864.2 | 9,800.9 | 10,783.6 | 5,920.0 | 10,791.1 | 11,244.2 | 11,716.3 | 12,208.1 | 12,720.7 |
| EBITDA, % | 19.02 | 24.09 | 16.43 | 14.57 | 9.57 | 16.73 | 16.73 | 16.73 | 16.73 | 16.73 |
| Depreciation | 344.1 | 1,400.4 | 1,240.7 | 982.6 | 433.3 | 850.3 | 886.0 | 923.2 | 961.9 | 1,002.3 |
| Depreciation, % | 0.59691 | 1.89 | 2.08 | 1.33 | 0.70006 | 1.32 | 1.32 | 1.32 | 1.32 | 1.32 |
| EBIT | 10,617.5 | 16,463.8 | 8,560.1 | 9,801.0 | 5,486.8 | 9,940.9 | 10,358.2 | 10,793.1 | 11,246.2 | 11,718.3 |
| EBIT, % | 18.42 | 22.2 | 14.35 | 13.24 | 8.87 | 15.42 | 15.42 | 15.42 | 15.42 | 15.42 |
| Total Cash | 16,124.1 | 18,472.5 | 29,470.4 | 36,591.4 | 38,156.0 | 27,519.7 | 28,675.1 | 29,878.9 | 31,133.3 | 32,440.4 |
| Total Cash, percent | .0 | .0 | .0 | .0 | .0 | .0 | .0 | .0 | .0 | .0 |
| Account Receivables | 1,354.4 | 1,417.5 | 1,547.2 | 152.2 | 1,073.7 | 1,134.4 | 1,182.0 | 1,231.6 | 1,283.3 | 1,337.2 |
| Account Receivables, % | 2.35 | 1.91 | 2.59 | 0.20557 | 1.73 | 1.76 | 1.76 | 1.76 | 1.76 | 1.76 |
| Inventories | 16,145.8 | 21,616.1 | 30,604.4 | 23,076.1 | 19,011.9 | 21,971.8 | 22,894.3 | 23,855.4 | 24,856.9 | 25,900.5 |
| Inventories, % | 28.01 | 29.15 | 51.3 | 31.18 | 30.72 | 34.07 | 34.07 | 34.07 | 34.07 | 34.07 |
| Accounts Payable | 4,741.6 | 6,443.7 | 8,414.9 | 7,016.9 | 5,168.9 | 6,300.8 | 6,565.4 | 6,841.0 | 7,128.2 | 7,427.5 |
| Accounts Payable, % | 8.23 | 8.69 | 14.11 | 9.48 | 8.35 | 9.77 | 9.77 | 9.77 | 9.77 | 9.77 |
| Capital Expenditure | -1,352.0 | -2,361.5 | -3,282.6 | -1,974.4 | -1,226.3 | -2,022.5 | -2,107.4 | -2,195.9 | -2,288.1 | -2,384.1 |
| Capital Expenditure, % | -2.35 | -3.18 | -5.5 | -2.67 | -1.98 | -3.14 | -3.14 | -3.14 | -3.14 | -3.14 |
| Tax Rate, % | 30.6 | 30.6 | 30.6 | 30.6 | 30.6 | 30.6 | 30.6 | 30.6 | 30.6 | 30.6 |
| EBITAT | 6,740.3 | 10,738.0 | 5,653.3 | 7,611.0 | 3,808.1 | 6,795.7 | 7,081.0 | 7,378.3 | 7,688.1 | 8,010.8 |
| Depreciation | ||||||||||
| Changes in Account Receivables | ||||||||||
| Changes in Inventories | ||||||||||
| Changes in Accounts Payable | ||||||||||
| Capital Expenditure | ||||||||||
| UFCF | -7,026.2 | 5,945.6 | -3,535.3 | 14,144.5 | 4,309.7 | 3,734.8 | 5,154.0 | 5,370.4 | 5,595.9 | 5,830.8 |
| WACC, % | 8.15 | 8.16 | 8.16 | 8.17 | 8.16 | 8.16 | 8.16 | 8.16 | 8.16 | 8.16 |
| PV UFCF | ||||||||||
| SUM PV UFCF | 20,130.8 | |||||||||
| Long Term Growth Rate, % | 2.00 | |||||||||
| Free cash flow (T + 1) | 5,947 | |||||||||
| Terminal Value | 96,544 | |||||||||
| Present Terminal Value | 65,220 | |||||||||
| Enterprise Value | 85,351 | |||||||||
| Net Debt | -33,371 | |||||||||
| Equity Value | 118,723 | |||||||||
| Diluted Shares Outstanding, MM | 2,069 | |||||||||
| Equity Value Per Share | 57.38 |
Benefits of Using This Model
- Customizable Forecast Inputs: Easily modify assumptions (growth %, margins, WACC) to create various scenarios for analysis.
- Real-Time Data: Pre-filled financial data from China Tourism Group Duty Free Corporation Limited (1880HK) to enhance your analysis.
- Automatic DCF Calculations: The template automatically computes Net Present Value (NPV) and intrinsic value for your convenience.
- Professional and Tailored: A sleek Excel model that can be adjusted to meet your specific valuation requirements.
- Designed for Analysts and Investors: Perfect for assessing projections, validating strategies, and optimizing your time.
Key Features
- Authentic 1880HK Data: Pre-populated with China Tourism Group Duty Free Corporation Limited’s historical performance and future estimates.
- Completely Customizable Inputs: Modify revenue growth rates, profit margins, discount rates, tax implications, and capital investments.
- Adaptive Valuation Model: Automatic recalculations of Net Present Value (NPV) and intrinsic value based on your specified parameters.
- Scenario Analysis: Generate various forecasting scenarios to explore diverse valuation results.
- User-Centric Design: Intuitive, organized layout suitable for both experienced professionals and newcomers.
How It Functions
- Download the Template: Obtain immediate access to the Excel-based CTG DCF Calculator for China Tourism Group Duty Free Corporation Limited (1880HK).
- Input Your Assumptions: Modify the yellow-highlighted cells for growth rates, WACC, margins, and other variables.
- Instant Calculations: The model automatically refreshes to display the intrinsic value of China Tourism Group Duty Free Corporation Limited (1880HK).
- Test Scenarios: Experiment with various assumptions to assess potential changes in valuation.
- Analyze and Decide: Utilize the findings to inform your investment or financial evaluations.
Why Opt for This Calculator?
- Designed for Experts: A sophisticated tool utilized by analysts, CFOs, and consultants.
- Real-World Insights: Historical and projected financial data for China Tourism Group Duty Free Corporation Limited (1880HK) preloaded for precision.
- Scenario Analysis: Effortlessly test various forecasts and assumptions.
- Transparent Results: Instantly calculates intrinsic value, NPV, and essential metrics.
- User-Friendly: Step-by-step guidance simplifies the process.
Who Should Consider Our Services?
- Tourism Students: Discover key industry trends and apply them using real-world data.
- Researchers: Integrate advanced models into your studies or academic work.
- Investors: Validate your investment strategies and assess market outcomes for China Tourism Group Duty Free Corporation Limited (1880HK).
- Market Analysts: Enhance your efficiency with a customizable financial model tailored for the tourism sector.
- Entrepreneurs: Learn how leading firms like China Tourism Group Duty Free Corporation Limited (1880HK) are evaluated and analyzed.
Contents of the Template
- Historical Data: Features past financial information and baseline forecasts for China Tourism Group Duty Free Corporation Limited (1880HK).
- DCF and Levered DCF Models: Comprehensive templates designed to determine the intrinsic value of China Tourism Group Duty Free Corporation Limited (1880HK).
- WACC Sheet: Pre-configured calculations for Weighted Average Cost of Capital specific to China Tourism Group Duty Free Corporation Limited (1880HK).
- Editable Inputs: Adjust essential drivers such as growth rates, EBITDA percentages, and CAPEX assumptions.
- Quarterly and Annual Statements: A thorough analysis of China Tourism Group Duty Free Corporation Limited (1880HK) financials.
- Interactive Dashboard: Dynamically visualize valuation results and future projections.
Disclaimer
All information, articles, and product details provided on this website are for general informational and educational purposes only. We do not claim any ownership over, nor do we intend to infringe upon, any trademarks, copyrights, logos, brand names, or other intellectual property mentioned or depicted on this site. Such intellectual property remains the property of its respective owners, and any references here are made solely for identification or informational purposes, without implying any affiliation, endorsement, or partnership.
We make no representations or warranties, express or implied, regarding the accuracy, completeness, or suitability of any content or products presented. Nothing on this website should be construed as legal, tax, investment, financial, medical, or other professional advice. In addition, no part of this site—including articles or product references—constitutes a solicitation, recommendation, endorsement, advertisement, or offer to buy or sell any securities, franchises, or other financial instruments, particularly in jurisdictions where such activity would be unlawful.
All content is of a general nature and may not address the specific circumstances of any individual or entity. It is not a substitute for professional advice or services. Any actions you take based on the information provided here are strictly at your own risk. You accept full responsibility for any decisions or outcomes arising from your use of this website and agree to release us from any liability in connection with your use of, or reliance upon, the content or products found herein.