
|
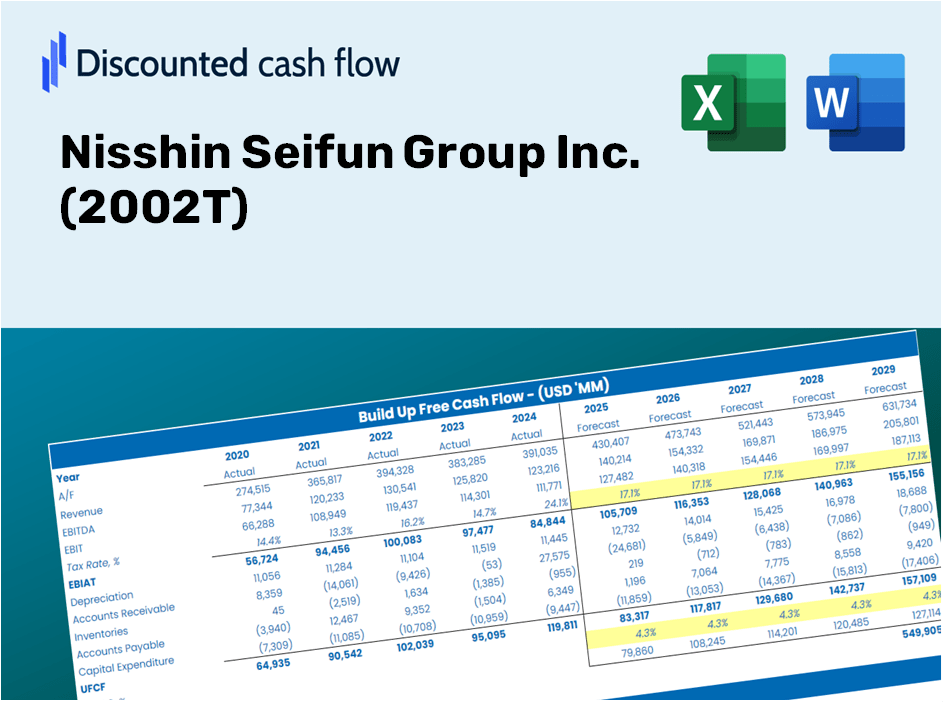
Nisshin Seifun Group Inc. (2002.T) Avaliação DCF |
Totalmente Editável: Adapte-Se Às Suas Necessidades No Excel Ou Planilhas
Design Profissional: Modelos Confiáveis E Padrão Da Indústria
Pré-Construídos Para Uso Rápido E Eficiente
Compatível com MAC/PC, totalmente desbloqueado
Não É Necessária Experiência; Fácil De Seguir
Nisshin Seifun Group Inc. (2002.T) Bundle
Seja você um investidor ou analista, esta calculadora DCF Nisshin Seifun Group Inc. (2002T) é o seu recurso preferido para uma avaliação precisa. Carregado com dados reais da Nisshin Seifun Group Inc., você pode ajustar as previsões e visualizar os efeitos em tempo real.
Benefits You Will Receive
- Genuine 2002T Financial Data: Pre-loaded with Nisshin Seifun Group's historical and forecasted figures for accurate analysis.
- Completely Customizable Template: Easily adjust essential inputs such as revenue growth, WACC, and EBITDA percentage.
- Instant Calculations: Watch Nisshin Seifun Group's intrinsic value refresh automatically as you make changes.
- Professional Valuation Tool: Crafted for investors, analysts, and consultants aiming for reliable DCF results.
- User-Friendly Interface: Intuitive layout and straightforward instructions suitable for all levels of experience.
Key Features
- Pre-Loaded Data: Nisshin Seifun Group Inc.'s historical financial statements and pre-filled forecasts.
- Fully Adjustable Inputs: Customize WACC, tax rates, revenue growth, and EBITDA margins as needed.
- Instant Results: View the intrinsic value of Nisshin Seifun Group Inc. recalculated in real time.
- Clear Visual Outputs: Dashboard charts present valuation results and essential metrics.
- Built for Accuracy: A professional-grade tool designed for analysts, investors, and finance professionals.
How It Operates
- Download the Template: Gain immediate access to the Excel-based Nisshin Seifun Group Inc. (2002T) DCF Calculator.
- Input Your Assumptions: Modify the yellow-highlighted cells for growth rates, WACC, margins, and other variables.
- Instant Calculations: The model automatically recalculates the intrinsic value of Nisshin Seifun Group Inc. (2002T).
- Test Scenarios: Experiment with various assumptions to assess potential valuation shifts.
- Analyze and Decide: Utilize the outcomes to inform your investment or financial strategy.
Why Choose the Nisshin Seifun Group Inc. (2002T) Calculator?
- All-in-One Solution: Features DCF, WACC, and various financial ratio analyses within a single tool.
- Flexible Inputs: Modify the highlighted cells to explore different financial scenarios.
- In-Depth Analysis: Automatically determines Nisshin Seifun's intrinsic value and Net Present Value.
- Ready-to-Use Data: Historical and projected data provide reliable starting points for your calculations.
- Expert-Level Quality: Perfect for financial analysts, investors, and business advisors.
Who Can Benefit from This Product?
- Finance Students: Master valuation techniques and apply them using real data specific to Nisshin Seifun Group Inc. (2002T).
- Academics: Integrate professional models into educational programs or research initiatives related to the food industry.
- Investors: Evaluate your own assumptions and analyze valuation results for Nisshin Seifun Group Inc. (2002T).
- Analysts: Enhance your productivity with a ready-to-use, customizable DCF model tailored for Nisshin Seifun Group Inc. (2002T).
- Small Business Owners: Understand the analysis techniques used for large public companies like Nisshin Seifun Group Inc. (2002T).
Contents of the Template
- Pre-Filled Data: Contains Nisshin Seifun Group Inc.'s (2002T) historical financial performance and forecasts.
- Discounted Cash Flow Model: An editable DCF valuation model with automated calculations.
- Weighted Average Cost of Capital (WACC): A dedicated worksheet for calculating WACC using custom inputs.
- Key Financial Ratios: Assess Nisshin Seifun Group Inc.'s (2002T) profitability, efficiency, and leverage metrics.
- Customizable Inputs: Easily modify revenue growth, profit margins, and tax rates.
- Clear Dashboard: Visual representations and tables summarizing the key valuation outcomes.
Disclaimer
All information, articles, and product details provided on this website are for general informational and educational purposes only. We do not claim any ownership over, nor do we intend to infringe upon, any trademarks, copyrights, logos, brand names, or other intellectual property mentioned or depicted on this site. Such intellectual property remains the property of its respective owners, and any references here are made solely for identification or informational purposes, without implying any affiliation, endorsement, or partnership.
We make no representations or warranties, express or implied, regarding the accuracy, completeness, or suitability of any content or products presented. Nothing on this website should be construed as legal, tax, investment, financial, medical, or other professional advice. In addition, no part of this site—including articles or product references—constitutes a solicitation, recommendation, endorsement, advertisement, or offer to buy or sell any securities, franchises, or other financial instruments, particularly in jurisdictions where such activity would be unlawful.
All content is of a general nature and may not address the specific circumstances of any individual or entity. It is not a substitute for professional advice or services. Any actions you take based on the information provided here are strictly at your own risk. You accept full responsibility for any decisions or outcomes arising from your use of this website and agree to release us from any liability in connection with your use of, or reliance upon, the content or products found herein.