
|
Dena Co., Ltd. (2432.T) Avaliação DCF |
Totalmente Editável: Adapte-Se Às Suas Necessidades No Excel Ou Planilhas
Design Profissional: Modelos Confiáveis E Padrão Da Indústria
Pré-Construídos Para Uso Rápido E Eficiente
Compatível com MAC/PC, totalmente desbloqueado
Não É Necessária Experiência; Fácil De Seguir
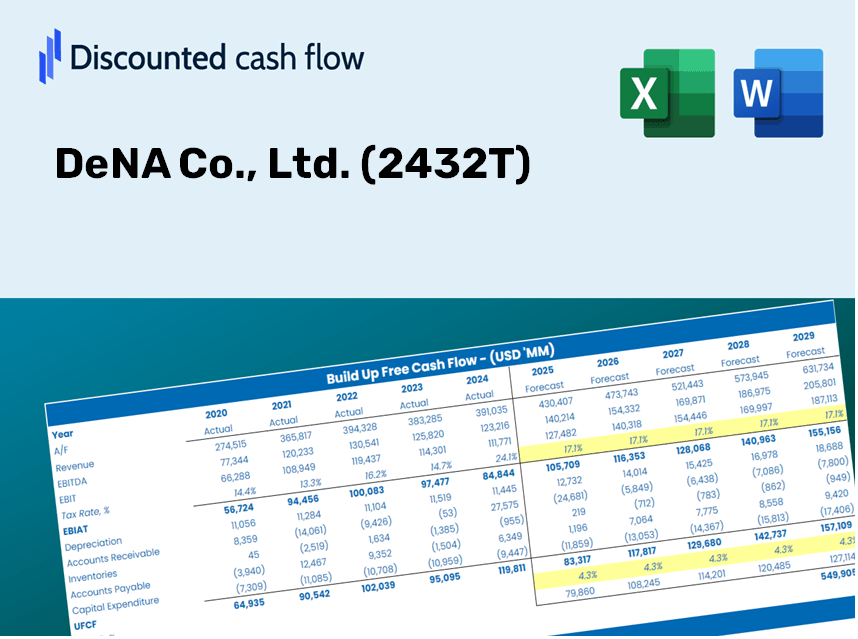
DeNA Co., Ltd. (2432.T) Bundle
Atualize sua análise e aumente a precisão com a nossa calculadora DCF (2432T)! Utilizando dados reais da Dena Co., Ltd. e suposições personalizáveis, essa ferramenta o capacita a prever, analisar e avaliar a Dena Co., Ltd., assim como um investidor experiente.
Discounted Cash Flow (DCF) - (USD MM)
| Year | AY1 2021 |
AY2 2022 |
AY3 2023 |
AY4 2024 |
AY5 2025 |
FY1 2026 |
FY2 2027 |
FY3 2028 |
FY4 2029 |
FY5 2030 |
|---|---|---|---|---|---|---|---|---|---|---|
| Revenue | 136,971.0 | 130,868.0 | 134,914.0 | 136,733.0 | 163,997.0 | 172,165.6 | 180,741.1 | 189,743.8 | 199,194.8 | 209,116.6 |
| Revenue Growth, % | 0 | -4.46 | 3.09 | 1.35 | 19.94 | 4.98 | 4.98 | 4.98 | 4.98 | 4.98 |
| EBITDA | 34,824.0 | 20,891.0 | 17,451.0 | -18,437.0 | 35,844.0 | 21,587.9 | 22,663.2 | 23,792.1 | 24,977.1 | 26,221.2 |
| EBITDA, % | 25.42 | 15.96 | 12.93 | -13.48 | 21.86 | 12.54 | 12.54 | 12.54 | 12.54 | 12.54 |
| Depreciation | 6,703.0 | 5,593.0 | 5,445.0 | 6,540.0 | 5,151.0 | 7,274.8 | 7,637.2 | 8,017.6 | 8,416.9 | 8,836.2 |
| Depreciation, % | 4.89 | 4.27 | 4.04 | 4.78 | 3.14 | 4.23 | 4.23 | 4.23 | 4.23 | 4.23 |
| EBIT | 28,121.0 | 15,298.0 | 12,006.0 | -24,977.0 | 30,693.0 | 14,313.1 | 15,026.0 | 15,774.5 | 16,560.2 | 17,385.1 |
| EBIT, % | 20.53 | 11.69 | 8.9 | -18.27 | 18.72 | 8.31 | 8.31 | 8.31 | 8.31 | 8.31 |
| Total Cash | 98,312.0 | 78,533.0 | 98,009.0 | 71,804.0 | 92,803.0 | 107,959.2 | 113,336.6 | 118,981.8 | 124,908.3 | 131,129.9 |
| Total Cash, percent | .0 | .0 | .0 | .0 | .0 | .0 | .0 | .0 | .0 | .0 |
| Account Receivables | 27,174.0 | 24,463.0 | 27,566.0 | 30,071.0 | 45,139.0 | 37,353.5 | 39,214.0 | 41,167.3 | 43,217.8 | 45,370.4 |
| Account Receivables, % | 19.84 | 18.69 | 20.43 | 21.99 | 27.52 | 21.7 | 21.7 | 21.7 | 21.7 | 21.7 |
| Inventories | 134.0 | .0 | .0 | .0 | .0 | 33.7 | 35.4 | 37.1 | 39.0 | 40.9 |
| Inventories, % | 0.09783093 | 0 | 0 | 0 | 0 | 0.01956619 | 0.01956619 | 0.01956619 | 0.01956619 | 0.01956619 |
| Accounts Payable | 169.0 | 179.0 | 336.0 | 21,337.0 | 23,609.0 | 10,505.6 | 11,028.8 | 11,578.2 | 12,154.9 | 12,760.3 |
| Accounts Payable, % | 0.12338 | 0.13678 | 0.24905 | 15.6 | 14.4 | 6.1 | 6.1 | 6.1 | 6.1 | 6.1 |
| Capital Expenditure | -9,273.0 | -6,433.0 | -7,581.0 | -10,555.0 | -4,252.0 | -9,509.4 | -9,983.0 | -10,480.3 | -11,002.3 | -11,550.3 |
| Capital Expenditure, % | -6.77 | -4.92 | -5.62 | -7.72 | -2.59 | -5.52 | -5.52 | -5.52 | -5.52 | -5.52 |
| Tax Rate, % | 18.01 | 18.01 | 18.01 | 18.01 | 18.01 | 18.01 | 18.01 | 18.01 | 18.01 | 18.01 |
| EBITAT | 23,057.1 | 15,876.8 | 7,821.8 | -25,467.1 | 25,164.6 | 12,284.4 | 12,896.2 | 13,538.6 | 14,212.9 | 14,920.9 |
| Depreciation | ||||||||||
| Changes in Account Receivables | ||||||||||
| Changes in Inventories | ||||||||||
| Changes in Accounts Payable | ||||||||||
| Capital Expenditure | ||||||||||
| UFCF | -6,651.9 | 17,891.8 | 2,739.8 | -10,986.1 | 13,267.6 | 4,698.2 | 9,211.4 | 9,670.2 | 10,151.9 | 10,657.5 |
| WACC, % | 4.28 | 4.38 | 4.19 | 4.38 | 4.28 | 4.3 | 4.3 | 4.3 | 4.3 | 4.3 |
| PV UFCF | ||||||||||
| SUM PV UFCF | 38,702.8 | |||||||||
| Long Term Growth Rate, % | 3.00 | |||||||||
| Free cash flow (T + 1) | 10,977 | |||||||||
| Terminal Value | 841,715 | |||||||||
| Present Terminal Value | 681,800 | |||||||||
| Enterprise Value | 720,502 | |||||||||
| Net Debt | -44,397 | |||||||||
| Equity Value | 764,899 | |||||||||
| Diluted Shares Outstanding, MM | 112 | |||||||||
| Equity Value Per Share | 6,858.49 |
Benefits of Using Our Model
- Adjustable Forecast Parameters: Modify key inputs (growth %, margins, WACC) to explore different scenarios effortlessly.
- Comprehensive Data: DeNA Co., Ltd.’s financial information pre-loaded to facilitate your analysis.
- Instant DCF Calculations: The template automatically computes Net Present Value (NPV) and intrinsic value for you.
- Professional and Flexible: A refined Excel model tailored to meet your valuation requirements.
- Designed for Analysts and Investors: Perfect for evaluating projections, confirming strategies, and enhancing efficiency.
Key Features
- 🔍 Real-Life DeNA Financials: Pre-filled historical and projected data for DeNA Co., Ltd. (2432T).
- ✏️ Fully Customizable Inputs: Modify all essential parameters (yellow cells) such as WACC, growth %, and tax rates.
- 📊 Professional DCF Valuation: Integrated formulas compute DeNA’s intrinsic value using the Discounted Cash Flow method.
- ⚡ Instant Results: Visualize DeNA’s valuation immediately after adjustments.
- Scenario Analysis: Evaluate and compare results for different financial assumptions side-by-side.
How It Operates
- 1. Access the Template: Download and open the Excel file featuring DeNA Co., Ltd.'s (2432T) preloaded data.
- 2. Modify Assumptions: Adjust key parameters such as growth rates, WACC, and capital expenditures.
- 3. View Results in Real-Time: The DCF model automatically calculates the intrinsic value and NPV.
- 4. Explore Different Scenarios: Analyze various forecasts to evaluate diverse valuation outcomes.
- 5. Utilize with Assurance: Present professional valuation insights to enhance your decision-making process.
Why Choose This Calculator for DeNA Co., Ltd. (2432T)?
- User-Friendly Interface: Perfectly tailored for both novices and seasoned users.
- Customizable Parameters: Effortlessly adjust inputs to suit your analytical needs.
- Real-Time Feedback: Instantly observe changes to DeNA’s valuation as you modify inputs.
- Pre-Configured Data: Comes preloaded with DeNA’s actual financial information for expedited analysis.
- Industry Approved: Widely utilized by investors and analysts for making educated decisions.
Who Should Use This Product?
- Individual Investors: Make informed decisions about buying or selling DeNA Co., Ltd. (2432T) stock.
- Financial Analysts: Enhance valuation processes using comprehensive financial models tailored for DeNA Co., Ltd. (2432T).
- Consultants: Provide clients with accurate and timely valuation insights related to DeNA Co., Ltd. (2432T).
- Business Owners: Gain insights into how large companies like DeNA Co., Ltd. (2432T) are valued to inform your own business strategies.
- Finance Students: Master valuation techniques by analyzing real-world data and scenarios related to DeNA Co., Ltd. (2432T).
What the Template Includes
- Pre-Filled DCF Model: DeNA Co., Ltd.’s financial data preloaded for immediate analysis.
- WACC Calculator: Comprehensive calculations for Weighted Average Cost of Capital.
- Financial Ratios: Assess DeNA’s profitability, leverage, and efficiency metrics.
- Editable Inputs: Adjust assumptions such as growth rates, profit margins, and CAPEX to align with your scenarios.
- Financial Statements: Access to annual and quarterly reports for thorough analysis.
- Interactive Dashboard: Visualize key valuation metrics and outcomes with ease.
Disclaimer
All information, articles, and product details provided on this website are for general informational and educational purposes only. We do not claim any ownership over, nor do we intend to infringe upon, any trademarks, copyrights, logos, brand names, or other intellectual property mentioned or depicted on this site. Such intellectual property remains the property of its respective owners, and any references here are made solely for identification or informational purposes, without implying any affiliation, endorsement, or partnership.
We make no representations or warranties, express or implied, regarding the accuracy, completeness, or suitability of any content or products presented. Nothing on this website should be construed as legal, tax, investment, financial, medical, or other professional advice. In addition, no part of this site—including articles or product references—constitutes a solicitation, recommendation, endorsement, advertisement, or offer to buy or sell any securities, franchises, or other financial instruments, particularly in jurisdictions where such activity would be unlawful.
All content is of a general nature and may not address the specific circumstances of any individual or entity. It is not a substitute for professional advice or services. Any actions you take based on the information provided here are strictly at your own risk. You accept full responsibility for any decisions or outcomes arising from your use of this website and agree to release us from any liability in connection with your use of, or reliance upon, the content or products found herein.