
|
O Nisshin Oillio Group, Ltd. (2602.T) Avaliação DCF |
Totalmente Editável: Adapte-Se Às Suas Necessidades No Excel Ou Planilhas
Design Profissional: Modelos Confiáveis E Padrão Da Indústria
Pré-Construídos Para Uso Rápido E Eficiente
Compatível com MAC/PC, totalmente desbloqueado
Não É Necessária Experiência; Fácil De Seguir
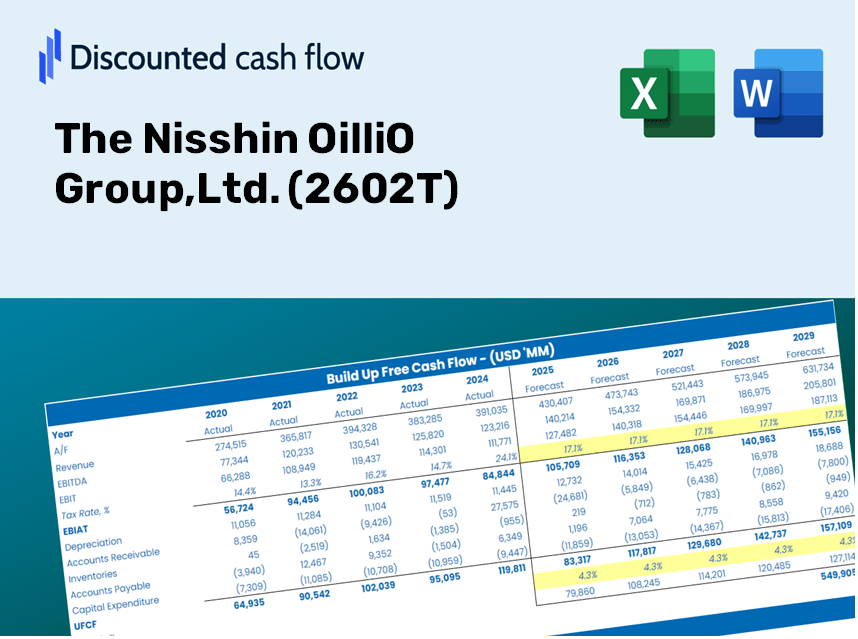
The Nisshin OilliO Group,Ltd. (2602.T) Bundle
Descubra o verdadeiro valor do Nisshin Oillio Group, Ltd. (2602T) com nossa calculadora DCF avançada! Ajuste as principais suposições, explore vários cenários e avalie como diferentes mudanças afetam a avaliação Nisshin Oillio Group, Ltd. (2602T) - tudo dentro de um modelo conveniente do Excel.
Benefits You Will Enjoy
- Pre-Populated Financial Model: Utilize Nisshin OilliO Group's (2602T) actual data for accurate DCF valuation.
- Comprehensive Forecast Management: Modify revenue growth, profit margins, WACC, and other essential parameters.
- Real-Time Calculations: Instant updates allow you to view results immediately as changes are made.
- Professional-Grade Template: A polished Excel file crafted for high-quality valuation purposes.
- Flexible and Reusable: Designed for adaptability, enabling repeated use for in-depth forecasting.
Key Features
- Customizable Forecast Inputs: Adjust essential metrics such as revenue growth, EBITDA %, and capital expenditures to fit your analysis.
- Instant DCF Valuation: Automatically computes intrinsic value, NPV, and various other outputs in real-time.
- High-Precision Results: Leverages Nisshin OilliO Group's real-world financial data for accurate valuation results.
- Simplified Scenario Analysis: Effortlessly evaluate different assumptions and analyze comparative outcomes.
- Efficiency Booster: Save time by avoiding the need to create intricate valuation models from the ground up.
How It Works
- Step 1: Download the Excel file.
- Step 2: Examine Nisshin OilliO Group's pre-filled financial data and forecasts.
- Step 3: Adjust key inputs such as revenue growth, WACC, and tax rates (highlighted cells).
- Step 4: Observe the DCF model update in real-time as you modify your assumptions.
- Step 5: Evaluate the outputs and leverage the results for your investment strategies.
Why Opt for This Calculator?
- Precision: Utilizes authentic Nisshin OilliO financial data for reliable results.
- Adaptability: Built to allow users to easily adjust and experiment with inputs.
- Efficient: Eliminate the need to create a DCF model from the ground up.
- Professional Quality: Crafted with the accuracy and usability expected at a CFO level.
- User-Friendly: Simple to navigate, even for those without extensive financial modeling expertise.
Who Can Benefit from This Product?
- Investors: Make informed investment choices utilizing a top-tier valuation tool.
- Financial Analysts: Streamline your workflow with a customizable DCF model readily available.
- Consultants: Easily tailor the template for client presentations or detailed reports.
- Finance Enthusiasts: Enhance your knowledge of valuation methods through practical examples.
- Educators and Students: Employ this resource as a hands-on learning aid in finance courses.
Contents of the Template
- Operating and Balance Sheet Data: Pre-filled historical data and forecasts for The Nisshin OilliO Group, Ltd. (2602T), including revenue, EBITDA, EBIT, and capital expenditures.
- WACC Calculation: A dedicated sheet for calculating the Weighted Average Cost of Capital (WACC), featuring parameters such as Beta, risk-free rate, and share price.
- DCF Valuation (Unlevered and Levered): Customizable Discounted Cash Flow models that present intrinsic value with comprehensive calculations.
- Financial Statements: Pre-loaded annual and quarterly financial statements to facilitate analysis.
- Key Ratios: Includes important profitability, leverage, and efficiency ratios for The Nisshin OilliO Group, Ltd. (2602T).
- Dashboard and Charts: Visual representations of valuation outputs and assumptions to simplify result analysis.
Disclaimer
All information, articles, and product details provided on this website are for general informational and educational purposes only. We do not claim any ownership over, nor do we intend to infringe upon, any trademarks, copyrights, logos, brand names, or other intellectual property mentioned or depicted on this site. Such intellectual property remains the property of its respective owners, and any references here are made solely for identification or informational purposes, without implying any affiliation, endorsement, or partnership.
We make no representations or warranties, express or implied, regarding the accuracy, completeness, or suitability of any content or products presented. Nothing on this website should be construed as legal, tax, investment, financial, medical, or other professional advice. In addition, no part of this site—including articles or product references—constitutes a solicitation, recommendation, endorsement, advertisement, or offer to buy or sell any securities, franchises, or other financial instruments, particularly in jurisdictions where such activity would be unlawful.
All content is of a general nature and may not address the specific circumstances of any individual or entity. It is not a substitute for professional advice or services. Any actions you take based on the information provided here are strictly at your own risk. You accept full responsibility for any decisions or outcomes arising from your use of this website and agree to release us from any liability in connection with your use of, or reliance upon, the content or products found herein.