
|
Nissin Foods Holdings Co., Ltd. (2897.T) Avaliação do DCF |
Totalmente Editável: Adapte-Se Às Suas Necessidades No Excel Ou Planilhas
Design Profissional: Modelos Confiáveis E Padrão Da Indústria
Pré-Construídos Para Uso Rápido E Eficiente
Compatível com MAC/PC, totalmente desbloqueado
Não É Necessária Experiência; Fácil De Seguir
Nissin Foods Holdings Co.,Ltd. (2897.T) Bundle
Procurando determinar o valor intrínseco da Nissin Foods Holdings Co., Ltd.? Nossa calculadora DCF (2897T) integra dados do mundo real com opções abrangentes de personalização, permitindo ajustar as previsões e fazer escolhas de investimento informadas.
What You Will Gain
- Authentic Nissin Foods (2897T) Financials: Features historical and projected data for precise valuation.
- Customizable Inputs: Adjust key metrics like WACC, tax rates, revenue growth, and capital expenditures.
- Instant Calculations: Dynamic calculations for intrinsic value and NPV.
- Scenario Analysis: Explore various scenarios to assess Nissin Foods' future performance.
- User-Friendly and Professional Design: Crafted for experts yet easy for newcomers to navigate.
Key Features
- Real-Life Nissin Foods Data: Pre-filled with Nissin Foods Holdings Co., Ltd.'s historical financials and future growth projections.
- Fully Customizable Inputs: Modify revenue growth, profit margins, discount rates, tax rates, and capital expenditures.
- Dynamic Valuation Model: Automatically updates Net Present Value (NPV) and intrinsic value based on your custom inputs.
- Scenario Testing: Generate various forecast scenarios to evaluate different valuation results.
- User-Friendly Design: Intuitive and organized layout suitable for both professionals and newcomers.
How It Works
- Step 1: Download the Excel file for Nissin Foods Holdings Co.,Ltd. (2897T).
- Step 2: Review the pre-filled financial data and forecasts for Nissin Foods.
- Step 3: Adjust key inputs such as revenue growth, WACC, and tax rates (highlighted cells).
- Step 4: Observe the DCF model update in real-time as you modify your assumptions.
- Step 5: Evaluate the outputs and utilize the findings for your investment strategies.
Why Opt for Nissin Foods Holdings Co., Ltd. (2897T)?
- Time-Efficient: Skip the hassle of building financial models from scratch – our tools are ready to go.
- Enhanced Accuracy: Dependable financial insights and formulas minimize valuation errors.
- Customizable Options: Adjust the models to align with your specific forecasts and assumptions.
- User-Friendly: Intuitive charts and outputs simplify your data analysis.
- Endorsed by Professionals: Crafted for experts who prioritize accuracy and functionality.
Who Should Consider This Product?
- Professional Investors: Develop comprehensive and trustworthy valuation models for analysis of Nissin Foods Holdings Co., Ltd. (2897T).
- Corporate Finance Teams: Evaluate valuation scenarios to inform strategic decisions within the organization.
- Consultants and Advisors: Deliver precise valuation insights for clients interested in Nissin Foods Holdings Co., Ltd. (2897T).
- Students and Educators: Utilize real-world data to enrich learning and practice in financial modeling.
- Food Industry Enthusiasts: Gain insights into the valuation processes of food companies like Nissin Foods Holdings Co., Ltd. (2897T).
Contents of the Template
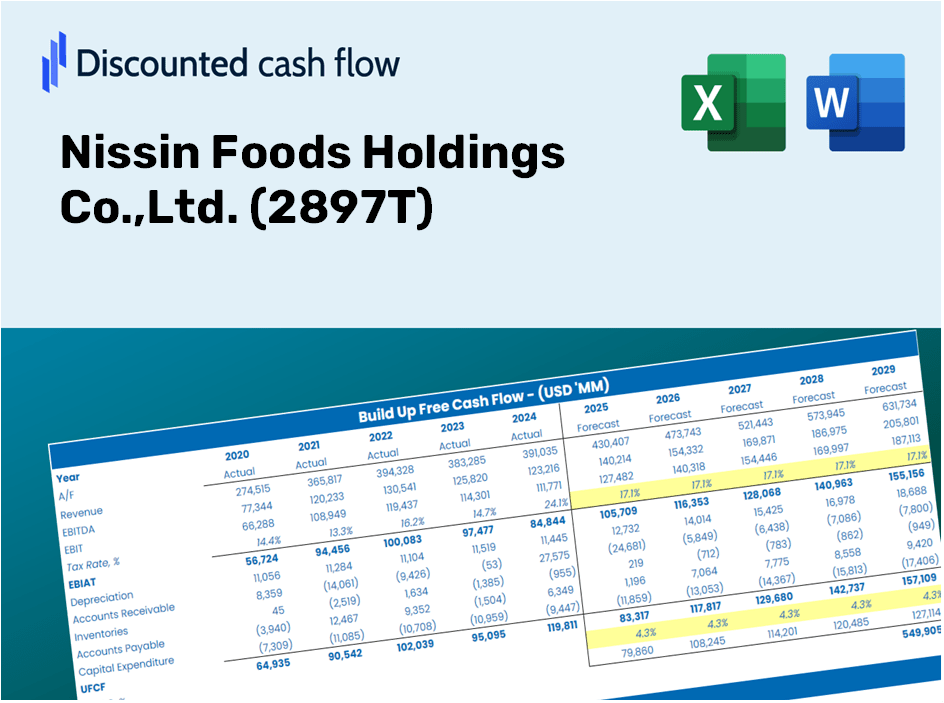
- Operating and Balance Sheet Data: Pre-filled historical data and forecasts for Nissin Foods Holdings Co., Ltd. (2897T), including revenue, EBITDA, EBIT, and capital expenditures.
- WACC Calculation: A dedicated sheet for calculating the Weighted Average Cost of Capital (WACC), featuring parameters such as Beta, risk-free rate, and share price.
- DCF Valuation (Unlevered and Levered): Customizable Discounted Cash Flow models that present intrinsic value along with detailed calculations.
- Financial Statements: Pre-loaded annual and quarterly financial statements to facilitate comprehensive analysis.
- Key Ratios: Includes essential profitability, leverage, and efficiency ratios for Nissin Foods Holdings Co., Ltd. (2897T).
- Dashboard and Charts: A visual summary of valuation outputs and assumptions that makes result analysis straightforward.
Disclaimer
All information, articles, and product details provided on this website are for general informational and educational purposes only. We do not claim any ownership over, nor do we intend to infringe upon, any trademarks, copyrights, logos, brand names, or other intellectual property mentioned or depicted on this site. Such intellectual property remains the property of its respective owners, and any references here are made solely for identification or informational purposes, without implying any affiliation, endorsement, or partnership.
We make no representations or warranties, express or implied, regarding the accuracy, completeness, or suitability of any content or products presented. Nothing on this website should be construed as legal, tax, investment, financial, medical, or other professional advice. In addition, no part of this site—including articles or product references—constitutes a solicitation, recommendation, endorsement, advertisement, or offer to buy or sell any securities, franchises, or other financial instruments, particularly in jurisdictions where such activity would be unlawful.
All content is of a general nature and may not address the specific circumstances of any individual or entity. It is not a substitute for professional advice or services. Any actions you take based on the information provided here are strictly at your own risk. You accept full responsibility for any decisions or outcomes arising from your use of this website and agree to release us from any liability in connection with your use of, or reliance upon, the content or products found herein.