
|
Jiangsu Olive Sensors High-Tech Co., Ltd. (300507.sz) Avaliação DCF |
Totalmente Editável: Adapte-Se Às Suas Necessidades No Excel Ou Planilhas
Design Profissional: Modelos Confiáveis E Padrão Da Indústria
Pré-Construídos Para Uso Rápido E Eficiente
Compatível com MAC/PC, totalmente desbloqueado
Não É Necessária Experiência; Fácil De Seguir
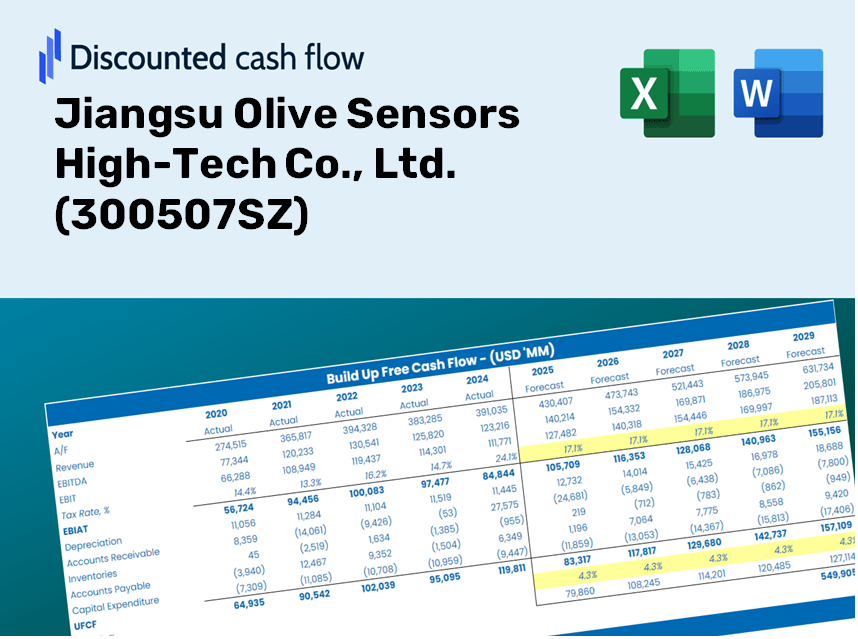
Jiangsu Olive Sensors High-Tech Co., Ltd. (300507.SZ) Bundle
Avalie as perspectivas financeiras dos sensores de oliveira de Jiangsu High-Tech Co., Ltd. como um especialista! Esta calculadora DCF (300507SZ) fornece dados financeiros pré-carregados e flexibilidade total para modificar o crescimento da receita, WACC, margens e outras suposições essenciais para se alinhar às suas projeções.
Discounted Cash Flow (DCF) - (USD MM)
| Year | AY1 2020 |
AY2 2021 |
AY3 2022 |
AY4 2023 |
AY5 2024 |
FY1 2025 |
FY2 2026 |
FY3 2027 |
FY4 2028 |
FY5 2029 |
|---|---|---|---|---|---|---|---|---|---|---|
| Revenue | 813.5 | 857.3 | 961.3 | 1,121.5 | 1,669.6 | 2,016.2 | 2,434.8 | 2,940.3 | 3,550.8 | 4,288.0 |
| Revenue Growth, % | 0 | 5.38 | 12.13 | 16.66 | 48.87 | 20.76 | 20.76 | 20.76 | 20.76 | 20.76 |
| EBITDA | 183.9 | 181.5 | 408.4 | 234.4 | 276.6 | 498.9 | 602.5 | 727.6 | 878.7 | 1,061.1 |
| EBITDA, % | 22.61 | 21.17 | 42.49 | 20.9 | 16.57 | 24.75 | 24.75 | 24.75 | 24.75 | 24.75 |
| Depreciation | 24.7 | 34.6 | 38.3 | 43.5 | 63.1 | 75.5 | 91.2 | 110.1 | 133.0 | 160.6 |
| Depreciation, % | 3.04 | 4.04 | 3.98 | 3.88 | 3.78 | 3.74 | 3.74 | 3.74 | 3.74 | 3.74 |
| EBIT | 159.2 | 146.9 | 370.2 | 190.9 | 213.5 | 423.4 | 511.4 | 617.5 | 745.8 | 900.6 |
| EBIT, % | 19.57 | 17.13 | 38.51 | 17.02 | 12.79 | 21 | 21 | 21 | 21 | 21 |
| Total Cash | 569.4 | 915.7 | 1,118.8 | 576.6 | 712.5 | 1,468.2 | 1,773.0 | 2,141.1 | 2,585.6 | 3,122.5 |
| Total Cash, percent | .0 | .0 | .0 | .0 | .0 | .0 | .0 | .0 | .0 | .0 |
| Account Receivables | 375.1 | 389.1 | 396.7 | 594.0 | 1,571.2 | 1,128.4 | 1,362.7 | 1,645.7 | 1,987.3 | 2,399.9 |
| Account Receivables, % | 46.11 | 45.38 | 41.27 | 52.97 | 94.11 | 55.97 | 55.97 | 55.97 | 55.97 | 55.97 |
| Inventories | 115.0 | 141.6 | 168.3 | 159.6 | 265.7 | 315.7 | 381.3 | 460.4 | 556.0 | 671.4 |
| Inventories, % | 14.13 | 16.51 | 17.5 | 14.23 | 15.92 | 15.66 | 15.66 | 15.66 | 15.66 | 15.66 |
| Accounts Payable | 155.8 | 162.9 | 160.0 | 233.3 | 1,153.3 | 583.4 | 704.5 | 850.8 | 1,027.4 | 1,240.8 |
| Accounts Payable, % | 19.15 | 19 | 16.65 | 20.8 | 69.08 | 28.94 | 28.94 | 28.94 | 28.94 | 28.94 |
| Capital Expenditure | -45.6 | -58.1 | -59.4 | -139.3 | -192.4 | -171.4 | -207.0 | -250.0 | -301.9 | -364.6 |
| Capital Expenditure, % | -5.61 | -6.78 | -6.18 | -12.43 | -11.52 | -8.5 | -8.5 | -8.5 | -8.5 | -8.5 |
| Tax Rate, % | 31.93 | 31.93 | 31.93 | 31.93 | 31.93 | 31.93 | 31.93 | 31.93 | 31.93 | 31.93 |
| EBITAT | 104.6 | 96.9 | 280.0 | 130.5 | 145.3 | 291.1 | 351.5 | 424.5 | 512.7 | 619.1 |
| Depreciation | ||||||||||
| Changes in Account Receivables | ||||||||||
| Changes in Inventories | ||||||||||
| Changes in Accounts Payable | ||||||||||
| Capital Expenditure | ||||||||||
| UFCF | -250.6 | 39.9 | 221.6 | -80.7 | -147.3 | 18.0 | 57.0 | 68.8 | 83.1 | 100.3 |
| WACC, % | 4.56 | 4.56 | 4.58 | 4.57 | 4.57 | 4.57 | 4.57 | 4.57 | 4.57 | 4.57 |
| PV UFCF | ||||||||||
| SUM PV UFCF | 279.2 | |||||||||
| Long Term Growth Rate, % | 3.00 | |||||||||
| Free cash flow (T + 1) | 103 | |||||||||
| Terminal Value | 6,587 | |||||||||
| Present Terminal Value | 5,268 | |||||||||
| Enterprise Value | 5,547 | |||||||||
| Net Debt | 86 | |||||||||
| Equity Value | 5,461 | |||||||||
| Diluted Shares Outstanding, MM | 811 | |||||||||
| Equity Value Per Share | 6.73 |
What You Will Receive
- Accurate 300507SZ Financials: Access to both historical and projected data for precise valuation analysis.
- Customizable Parameters: Adjust inputs such as WACC, tax rates, revenue growth, and capital expenditures as needed.
- Dynamic Calculations: Intrinsic value and NPV are automatically computed in real-time.
- Scenario Planning: Evaluate a range of scenarios to forecast Jiangsu Olive Sensors' future performance.
- User-Friendly Interface: Designed for professionals, yet easy to use for those new to financial analysis.
Key Features
- Comprehensive Data: Access to Jiangsu Olive Sensors’ historical financial records and automated forecasts.
- Customizable Parameters: Modify WACC, tax rates, revenue growth projections, and EBITDA margins as needed.
- Real-Time Insights: Instantly view recalibrated intrinsic value for Jiangsu Olive Sensors (300507SZ).
- Visualized Metrics: Dynamic dashboard charts illustrate valuation outcomes and essential statistics.
- Designed for Precision: A robust tool tailored for analysts, investors, and finance specialists.
How It Works
- 1. Access the Template: Download and open the Excel file containing Jiangsu Olive Sensors High-Tech Co., Ltd.'s preloaded data.
- 2. Modify Assumptions: Adjust critical inputs such as growth rates, WACC, and capital expenditures.
- 3. Get Instant Results: The DCF model will automatically compute intrinsic value and NPV in real-time.
- 4. Explore Scenarios: Analyze different valuation outcomes by comparing multiple forecasts.
- 5. Make Informed Decisions: Utilize professional valuation insights to support your strategies confidently.
Why Opt for This Calculator?
- Designed for Experts: A sophisticated tool favored by analysts, CFOs, and consultants in the field.
- Accurate Data: Pre-loaded historical and projected financials for Jiangsu Olive Sensors High-Tech Co., Ltd. (300507SZ) to ensure precision.
- Forecast Scenarios: Effortlessly simulate various predictions and assumptions.
- Comprehensive Outputs: Automatically calculates intrinsic value, NPV, and essential metrics.
- User-Friendly: Clear, step-by-step guidance lead you through each stage of the process.
Who Should Utilize This Product?
- Investors: Accurately assess the fair value of Jiangsu Olive Sensors High-Tech Co., Ltd. (300507SZ) prior to making investment choices.
- CFOs: Utilize a top-tier DCF model for comprehensive financial reporting and analysis.
- Consultants: Easily customize the template for client valuation reports.
- Entrepreneurs: Acquire insights into financial modeling practices commonly used by industry leaders.
- Educators: Implement it as a pedagogical resource to illustrate valuation techniques.
Contents of the Template
- In-Depth DCF Model: Editable template featuring comprehensive valuation calculations.
- Real-World Data: Historical and projected financials for Jiangsu Olive Sensors High-Tech Co., Ltd. (300507SZ) preloaded for analysis.
- Customizable Parameters: Modify WACC, growth rates, and tax assumptions to evaluate different scenarios.
- Financial Statements: Complete annual and quarterly breakdowns for enhanced insights.
- Key Ratios: Inherent analysis for profitability, efficiency, and leverage metrics.
- Dashboard with Visual Outputs: Charts and tables providing clear, actionable results.
Disclaimer
All information, articles, and product details provided on this website are for general informational and educational purposes only. We do not claim any ownership over, nor do we intend to infringe upon, any trademarks, copyrights, logos, brand names, or other intellectual property mentioned or depicted on this site. Such intellectual property remains the property of its respective owners, and any references here are made solely for identification or informational purposes, without implying any affiliation, endorsement, or partnership.
We make no representations or warranties, express or implied, regarding the accuracy, completeness, or suitability of any content or products presented. Nothing on this website should be construed as legal, tax, investment, financial, medical, or other professional advice. In addition, no part of this site—including articles or product references—constitutes a solicitation, recommendation, endorsement, advertisement, or offer to buy or sell any securities, franchises, or other financial instruments, particularly in jurisdictions where such activity would be unlawful.
All content is of a general nature and may not address the specific circumstances of any individual or entity. It is not a substitute for professional advice or services. Any actions you take based on the information provided here are strictly at your own risk. You accept full responsibility for any decisions or outcomes arising from your use of this website and agree to release us from any liability in connection with your use of, or reliance upon, the content or products found herein.