
|
Hoshine Silicon Industry Co., Ltd. (603260.SS) Avaliação DCF |
Totalmente Editável: Adapte-Se Às Suas Necessidades No Excel Ou Planilhas
Design Profissional: Modelos Confiáveis E Padrão Da Indústria
Pré-Construídos Para Uso Rápido E Eficiente
Compatível com MAC/PC, totalmente desbloqueado
Não É Necessária Experiência; Fácil De Seguir
Hoshine Silicon Industry Co., Ltd. (603260.SS) Bundle
Simplifique a avaliação Hoshine Silicon Industry Co., Ltd. (603260SS) com esta calculadora DCF personalizável! Apresentando a Indústria de Silício Hoshine Real Co., Ltd. (603260SS) e insumos de previsão ajustáveis, você pode testar cenários e descobrir o valor justo Hoshine Silicon Industry Co., Ltd. (603260S) em minutos.
Discounted Cash Flow (DCF) - (USD MM)
| Year | AY1 2020 |
AY2 2021 |
AY3 2022 |
AY4 2023 |
AY5 2024 |
FY1 2025 |
FY2 2026 |
FY3 2027 |
FY4 2028 |
FY5 2029 |
|---|---|---|---|---|---|---|---|---|---|---|
| Revenue | 8,968.2 | 21,385.5 | 23,656.9 | 26,583.6 | 26,692.3 | 34,926.9 | 45,702.0 | 59,801.2 | 78,250.1 | 102,390.5 |
| Revenue Growth, % | 0 | 138.46 | 10.62 | 12.37 | 0.40885 | 30.85 | 30.85 | 30.85 | 30.85 | 30.85 |
| EBITDA | 2,920.4 | 11,263.3 | 8,175.1 | 5,696.9 | 6,057.4 | 11,449.9 | 14,982.2 | 19,604.3 | 25,652.3 | 33,566.1 |
| EBITDA, % | 32.56 | 52.67 | 34.56 | 21.43 | 22.69 | 32.78 | 32.78 | 32.78 | 32.78 | 32.78 |
| Depreciation | 1,106.5 | 1,273.8 | 1,625.0 | 2,148.4 | 3,071.5 | 3,126.1 | 4,090.5 | 5,352.5 | 7,003.7 | 9,164.4 |
| Depreciation, % | 12.34 | 5.96 | 6.87 | 8.08 | 11.51 | 8.95 | 8.95 | 8.95 | 8.95 | 8.95 |
| EBIT | 1,813.9 | 9,989.5 | 6,550.1 | 3,548.4 | 2,985.9 | 8,323.8 | 10,891.7 | 14,251.9 | 18,648.6 | 24,401.8 |
| EBIT, % | 20.23 | 46.71 | 27.69 | 13.35 | 11.19 | 23.83 | 23.83 | 23.83 | 23.83 | 23.83 |
| Total Cash | 349.1 | 1,243.9 | 3,149.8 | 2,488.3 | 1,884.5 | 2,755.3 | 3,605.4 | 4,717.6 | 6,173.0 | 8,077.4 |
| Total Cash, percent | .0 | .0 | .0 | .0 | .0 | .0 | .0 | .0 | .0 | .0 |
| Account Receivables | 559.4 | 2,284.3 | 789.2 | 1,857.6 | 890.4 | 2,136.0 | 2,795.0 | 3,657.2 | 4,785.5 | 6,261.8 |
| Account Receivables, % | 6.24 | 10.68 | 3.34 | 6.99 | 3.34 | 6.12 | 6.12 | 6.12 | 6.12 | 6.12 |
| Inventories | 2,504.9 | 4,532.9 | 7,610.5 | 7,148.1 | 9,508.6 | 10,045.7 | 13,144.8 | 17,200.0 | 22,506.2 | 29,449.5 |
| Inventories, % | 27.93 | 21.2 | 32.17 | 26.89 | 35.62 | 28.76 | 28.76 | 28.76 | 28.76 | 28.76 |
| Accounts Payable | 4,062.3 | 3,963.1 | 8,812.3 | 15,204.4 | 19,190.2 | 16,078.1 | 21,038.2 | 27,528.6 | 36,021.3 | 47,133.9 |
| Accounts Payable, % | 45.3 | 18.53 | 37.25 | 57.19 | 71.89 | 46.03 | 46.03 | 46.03 | 46.03 | 46.03 |
| Capital Expenditure | -1,305.3 | -2,648.6 | -11,484.1 | -18,656.7 | -5,609.0 | -11,643.2 | -15,235.1 | -19,935.2 | -26,085.3 | -34,132.7 |
| Capital Expenditure, % | -14.55 | -12.39 | -48.54 | -70.18 | -21.01 | -33.34 | -33.34 | -33.34 | -33.34 | -33.34 |
| Tax Rate, % | 21.92 | 21.92 | 21.92 | 21.92 | 21.92 | 21.92 | 21.92 | 21.92 | 21.92 | 21.92 |
| EBITAT | 1,592.7 | 8,371.5 | 5,337.8 | 2,708.8 | 2,331.3 | 6,784.2 | 8,877.1 | 11,615.7 | 15,199.2 | 19,888.2 |
| Depreciation | ||||||||||
| Changes in Account Receivables | ||||||||||
| Changes in Inventories | ||||||||||
| Changes in Accounts Payable | ||||||||||
| Capital Expenditure | ||||||||||
| UFCF | 2,392.0 | 3,144.6 | -1,254.6 | -8,013.4 | 2,386.4 | -6,627.7 | -1,065.4 | -1,394.1 | -1,824.2 | -2,387.0 |
| WACC, % | 4.76 | 4.72 | 4.69 | 4.64 | 4.66 | 4.69 | 4.69 | 4.69 | 4.69 | 4.69 |
| PV UFCF | ||||||||||
| SUM PV UFCF | -11,934.0 | |||||||||
| Long Term Growth Rate, % | 2.00 | |||||||||
| Free cash flow (T + 1) | -2,435 | |||||||||
| Terminal Value | -90,441 | |||||||||
| Present Terminal Value | -71,911 | |||||||||
| Enterprise Value | -83,845 | |||||||||
| Net Debt | 20,601 | |||||||||
| Equity Value | -104,447 | |||||||||
| Diluted Shares Outstanding, MM | 1,176 | |||||||||
| Equity Value Per Share | -88.82 |
What Awaits You
- Customizable Excel Template: A fully adaptable Excel-based DCF Calculator featuring pre-filled real financials for Hoshine Silicon Industry Co., Ltd. (603260SS).
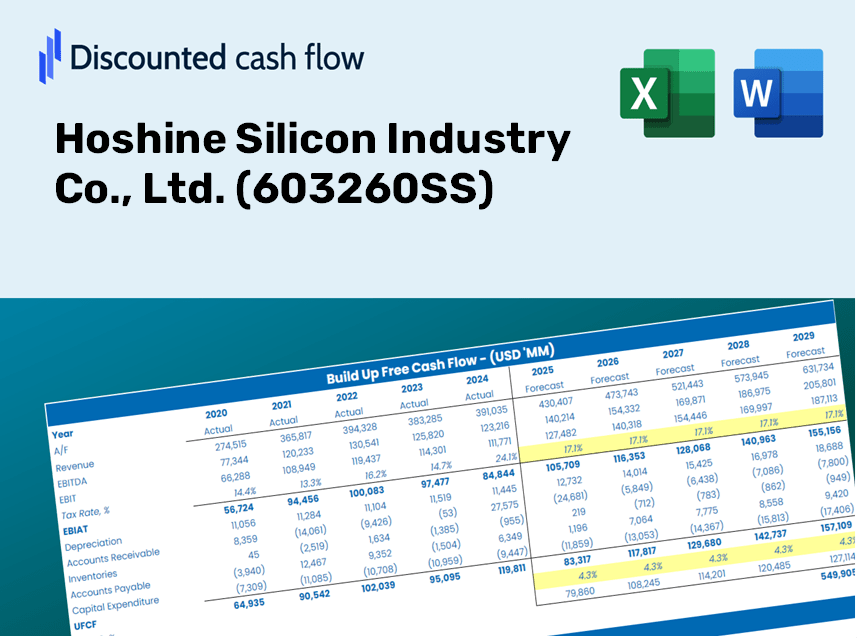
- Authentic Data: Access to historical figures and future estimates (highlighted in the yellow cells).
- Flexible Forecasting: Adjust key assumptions such as revenue growth, EBITDA margin, and WACC.
- Instant Calculations: Quickly observe how your inputs affect Hoshine's valuation.
- Professional Resource: Designed for investors, CFOs, consultants, and financial analysts.
- Intuitive Design: Organized for easy comprehension and navigation, complete with step-by-step guidance.
Key Features
- Comprehensive DCF Calculator: Offers detailed unlevered and levered DCF valuation models tailored for Hoshine Silicon Industry Co., Ltd. (603260SS).
- WACC Calculator: Pre-configured Weighted Average Cost of Capital sheet with adjustable inputs specific to the semiconductor industry.
- Customizable Forecast Assumptions: Easily modify parameters such as growth rates, capital expenditures, and discount rates.
- Integrated Financial Ratios: Evaluate profitability, leverage, and efficiency ratios relevant to Hoshine Silicon Industry Co., Ltd. (603260SS).
- Interactive Dashboard and Charts: Visual representations summarize crucial valuation metrics for straightforward analysis.
How It Functions
- Download the Template: Gain immediate access to the Excel-based Hoshine Silicon DCF Calculator for [603260SS].
- Input Your Assumptions: Modify the yellow-highlighted cells for growth rates, WACC, profit margins, and additional variables.
- Instant Calculations: The model automatically recalculates the intrinsic value of Hoshine Silicon.
- Test Scenarios: Explore various assumptions to assess potential shifts in valuation.
- Analyze and Decide: Leverage the findings to inform your investment or financial decisions.
Why Choose Hoshine Silicon Industry's Calculator?
- Designed for Experts: A sophisticated tool tailored for analysts, CFOs, and industry consultants.
- Comprehensive Data: Hoshine's historical and projected financials are preloaded for optimal accuracy.
- Scenario Analysis: Effortlessly test various forecasts and assumptions.
- Insightful Outputs: Automatically generates intrinsic value, NPV, and essential financial metrics.
- User-Friendly: Step-by-step guidance ensures a seamless experience.
Who Can Benefit from Hoshine Silicon Industry Co., Ltd. (603260SS)?
- Investors: Make informed choices with our advanced valuation tools tailored for the silicon industry.
- Financial Analysts: Optimize your workflow with our customizable DCF model designed specifically for Hoshine Silicon's financial landscape.
- Consultants: Effortlessly modify templates for client presentations or in-depth reports on Hoshine Silicon’s market performance.
- Finance Enthusiasts: Explore real-world examples to enhance your grasp of valuation techniques in the context of the silicon market.
- Educators and Students: Leverage our resources as a hands-on learning tool for finance and investment courses.
What the Template Contains for Hoshine Silicon Industry Co., Ltd. (603260SS)
- Preloaded Hoshine Data: Historical and projected financial data, including revenue, EBIT, and capital expenditures.
- DCF and WACC Models: Professional-grade worksheets for calculating intrinsic value and Weighted Average Cost of Capital.
- Editable Inputs: Yellow-highlighted cells for modifying revenue growth, tax rates, and discount rates.
- Financial Statements: Detailed annual and quarterly financials for in-depth analysis.
- Key Ratios: Profitability, leverage, and efficiency ratios to assess performance.
- Dashboard and Charts: Visual representations of valuation results and key assumptions.
Disclaimer
All information, articles, and product details provided on this website are for general informational and educational purposes only. We do not claim any ownership over, nor do we intend to infringe upon, any trademarks, copyrights, logos, brand names, or other intellectual property mentioned or depicted on this site. Such intellectual property remains the property of its respective owners, and any references here are made solely for identification or informational purposes, without implying any affiliation, endorsement, or partnership.
We make no representations or warranties, express or implied, regarding the accuracy, completeness, or suitability of any content or products presented. Nothing on this website should be construed as legal, tax, investment, financial, medical, or other professional advice. In addition, no part of this site—including articles or product references—constitutes a solicitation, recommendation, endorsement, advertisement, or offer to buy or sell any securities, franchises, or other financial instruments, particularly in jurisdictions where such activity would be unlawful.
All content is of a general nature and may not address the specific circumstances of any individual or entity. It is not a substitute for professional advice or services. Any actions you take based on the information provided here are strictly at your own risk. You accept full responsibility for any decisions or outcomes arising from your use of this website and agree to release us from any liability in connection with your use of, or reliance upon, the content or products found herein.