
|
Juewei Food Co., Ltd. (603517.SS) Avaliação DCF |
Totalmente Editável: Adapte-Se Às Suas Necessidades No Excel Ou Planilhas
Design Profissional: Modelos Confiáveis E Padrão Da Indústria
Pré-Construídos Para Uso Rápido E Eficiente
Compatível com MAC/PC, totalmente desbloqueado
Não É Necessária Experiência; Fácil De Seguir
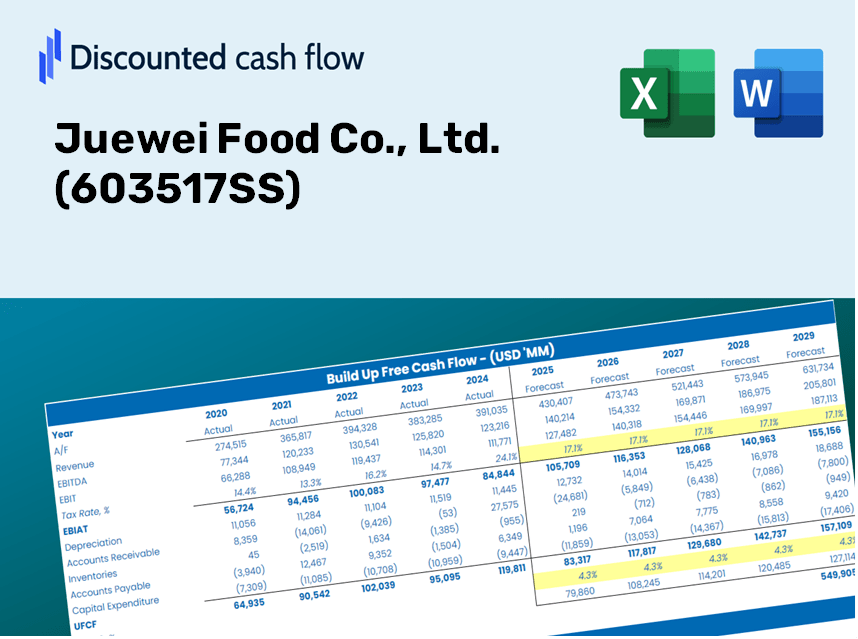
Juewei Food Co., Ltd. (603517.SS) Bundle
Explore o potencial financeiro da Juewei Food Co., Ltd. (603517Ss) com nossa calculadora DCF amigável! Digite suas projeções de crescimento, margens e despesas para calcular o valor intrínseco da Juewei Food Co., Ltd. (603517Ss) e aprimore sua abordagem de investimento.
What You Will Receive
- Genuine Juewei Financial Data: Access to historical and projected metrics for precise valuation.
- Customizable Parameters: Adjust WACC, tax rates, revenue growth, and capital expenditures as needed.
- Real-time Calculations: Intrinsic value and NPV are automatically calculated for your convenience.
- Scenario Analysis: Explore various scenarios to assess Juewei's future prospects.
- User-Friendly Interface: Designed for professionals while remaining easy to navigate for newcomers.
Key Features
- Comprehensive DCF Calculator: Offers detailed unlevered and levered DCF valuation models tailored for Juewei Food Co., Ltd. (603517SS).
- WACC Calculator: Features a pre-made Weighted Average Cost of Capital sheet with adjustable inputs specific to the food industry.
- Customizable Forecast Assumptions: Adjust parameters such as growth rates, capital expenditures, and discount rates to align with Juewei's strategy.
- Integrated Financial Ratios: Evaluate profitability, leverage, and efficiency ratios relevant to Juewei Food Co., Ltd. (603517SS).
- Visual Dashboard and Charts: Provides graphical representations to highlight key valuation metrics for straightforward analysis.
How It Works
- Step 1: Download the Excel spreadsheet.
- Step 2: Examine the pre-filled data for Juewei Food Co., Ltd. (603517SS) (historical and future projections).
- Step 3: Modify key assumptions (highlighted in yellow) based on your insights.
- Step 4: Review the automatic recalculations for Juewei Food Co., Ltd.'s (603517SS) intrinsic value.
- Step 5: Utilize the results for your investment strategies or reporting needs.
Why Opt for Juewei Food Co., Ltd. (603517SS) Calculator?
- Data Integrity: Utilize authentic Juewei financial data for reliable results.
- Customizable: Built to allow users to experiment and adjust inputs as needed.
- Efficiency: Avoid the complexities of creating a DCF model from the ground up.
- High-Quality: Crafted with the precision and functionality expected at the CFO level.
- Intuitive Interface: Simple to navigate, perfect for users with limited financial modeling skills.
Who Should Use This Product?
- Individual Investors: Gain insights to make well-informed decisions regarding investments in Juewei Food Co., Ltd. (603517SS).
- Financial Analysts: Enhance valuation processes with comprehensive, ready-to-use financial models for Juewei Food Co., Ltd. (603517SS).
- Consultants: Provide clients with swift and accurate valuation insights related to Juewei Food Co., Ltd. (603517SS).
- Business Owners: Learn how companies like Juewei Food Co., Ltd. (603517SS) are valued to inform your own business strategies.
- Finance Students: Develop valuation skills by analyzing real-world data and scenarios involving Juewei Food Co., Ltd. (603517SS).
Contents of the Template
- Pre-Filled Data: Contains Juewei Food Co., Ltd.'s (603517SS) historical financials and future projections.
- Discounted Cash Flow Model: An editable DCF valuation model featuring automatic calculations.
- Weighted Average Cost of Capital (WACC): A dedicated sheet for WACC calculations using your custom inputs.
- Key Financial Ratios: Evaluate Juewei Food Co., Ltd.'s profitability, efficiency, and leverage.
- Customizable Inputs: Easily adjust revenue growth, margins, and tax rates.
- Clear Dashboard: Visual representations such as charts and tables summarizing essential valuation results.
Disclaimer
All information, articles, and product details provided on this website are for general informational and educational purposes only. We do not claim any ownership over, nor do we intend to infringe upon, any trademarks, copyrights, logos, brand names, or other intellectual property mentioned or depicted on this site. Such intellectual property remains the property of its respective owners, and any references here are made solely for identification or informational purposes, without implying any affiliation, endorsement, or partnership.
We make no representations or warranties, express or implied, regarding the accuracy, completeness, or suitability of any content or products presented. Nothing on this website should be construed as legal, tax, investment, financial, medical, or other professional advice. In addition, no part of this site—including articles or product references—constitutes a solicitation, recommendation, endorsement, advertisement, or offer to buy or sell any securities, franchises, or other financial instruments, particularly in jurisdictions where such activity would be unlawful.
All content is of a general nature and may not address the specific circumstances of any individual or entity. It is not a substitute for professional advice or services. Any actions you take based on the information provided here are strictly at your own risk. You accept full responsibility for any decisions or outcomes arising from your use of this website and agree to release us from any liability in connection with your use of, or reliance upon, the content or products found herein.