
|
Jiajiayue Group Co., Ltd. (603708.SS) Avaliação DCF |
Totalmente Editável: Adapte-Se Às Suas Necessidades No Excel Ou Planilhas
Design Profissional: Modelos Confiáveis E Padrão Da Indústria
Pré-Construídos Para Uso Rápido E Eficiente
Compatível com MAC/PC, totalmente desbloqueado
Não É Necessária Experiência; Fácil De Seguir
Jiajiayue Group Co., Ltd. (603708.SS) Bundle
Projetado para precisão, nossa calculadora DCF (603708SS) permite avaliar a avaliação do Jiajiayue Group Co., Ltd. usando dados financeiros do mundo real, oferecendo total flexibilidade para modificar todos os parâmetros essenciais para projeções aprimoradas.
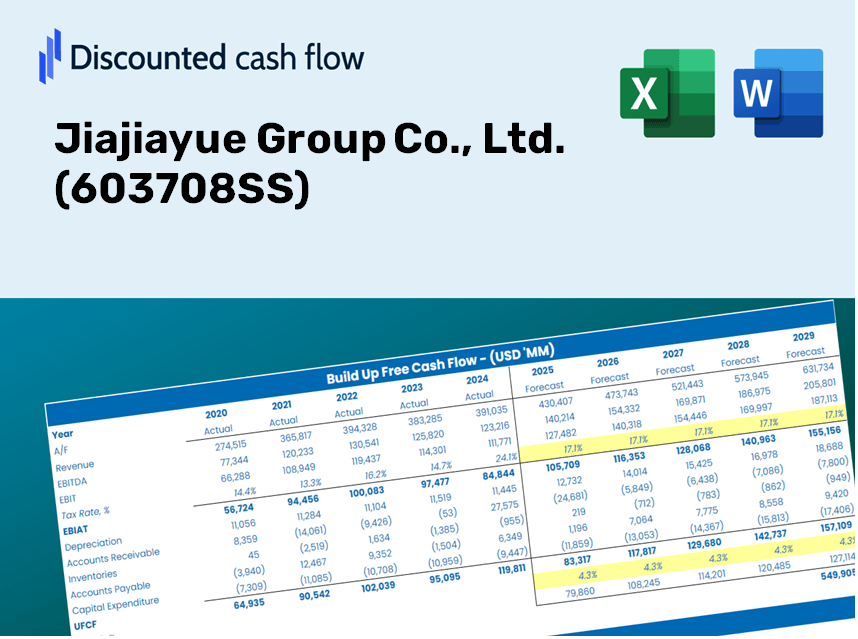
Discounted Cash Flow (DCF) - (USD MM)
| Year | AY1 2020 |
AY2 2021 |
AY3 2022 |
AY4 2023 |
AY5 2024 |
FY1 2025 |
FY2 2026 |
FY3 2027 |
FY4 2028 |
FY5 2029 |
|---|---|---|---|---|---|---|---|---|---|---|
| Revenue | 16,678.5 | 17,432.8 | 18,183.8 | 17,763.0 | 18,255.5 | 19,048.2 | 19,875.3 | 20,738.3 | 21,638.8 | 22,578.4 |
| Revenue Growth, % | 0 | 4.52 | 4.31 | -2.31 | 2.77 | 4.34 | 4.34 | 4.34 | 4.34 | 4.34 |
| EBITDA | 1,032.7 | 720.8 | 1,197.1 | 1,225.8 | 1,409.5 | 1,201.2 | 1,253.4 | 1,307.8 | 1,364.6 | 1,423.9 |
| EBITDA, % | 6.19 | 4.13 | 6.58 | 6.9 | 7.72 | 6.31 | 6.31 | 6.31 | 6.31 | 6.31 |
| Depreciation | 395.2 | 931.1 | 1,008.0 | 784.7 | 953.5 | 872.2 | 910.1 | 949.6 | 990.8 | 1,033.9 |
| Depreciation, % | 2.37 | 5.34 | 5.54 | 4.42 | 5.22 | 4.58 | 4.58 | 4.58 | 4.58 | 4.58 |
| EBIT | 637.5 | -210.4 | 189.1 | 441.2 | 456.0 | 329.0 | 343.3 | 358.2 | 373.8 | 390.0 |
| EBIT, % | 3.82 | -1.21 | 1.04 | 2.48 | 2.5 | 1.73 | 1.73 | 1.73 | 1.73 | 1.73 |
| Total Cash | 2,083.4 | 1,931.0 | 1,721.9 | 2,629.5 | 2,162.9 | 2,273.9 | 2,372.7 | 2,475.7 | 2,583.2 | 2,695.4 |
| Total Cash, percent | .0 | .0 | .0 | .0 | .0 | .0 | .0 | .0 | .0 | .0 |
| Account Receivables | 325.2 | 275.8 | 349.5 | 240.8 | 249.8 | 311.5 | 325.1 | 339.2 | 353.9 | 369.3 |
| Account Receivables, % | 1.95 | 1.58 | 1.92 | 1.36 | 1.37 | 1.64 | 1.64 | 1.64 | 1.64 | 1.64 |
| Inventories | 2,083.2 | 2,414.3 | 2,574.2 | 2,019.6 | 2,139.2 | 2,422.3 | 2,527.5 | 2,637.3 | 2,751.8 | 2,871.3 |
| Inventories, % | 12.49 | 13.85 | 14.16 | 11.37 | 11.72 | 12.72 | 12.72 | 12.72 | 12.72 | 12.72 |
| Accounts Payable | 2,690.9 | 2,812.1 | 3,376.9 | 3,389.6 | 2,943.9 | 3,278.0 | 3,420.3 | 3,568.8 | 3,723.8 | 3,885.5 |
| Accounts Payable, % | 16.13 | 16.13 | 18.57 | 19.08 | 16.13 | 17.21 | 17.21 | 17.21 | 17.21 | 17.21 |
| Capital Expenditure | -826.7 | -849.6 | -724.2 | -606.2 | -477.2 | -755.9 | -788.7 | -822.9 | -858.6 | -895.9 |
| Capital Expenditure, % | -4.96 | -4.87 | -3.98 | -3.41 | -2.61 | -3.97 | -3.97 | -3.97 | -3.97 | -3.97 |
| Tax Rate, % | 29.47 | 29.47 | 29.47 | 29.47 | 29.47 | 29.47 | 29.47 | 29.47 | 29.47 | 29.47 |
| EBITAT | 467.4 | -284.3 | 36.4 | 284.5 | 321.6 | 215.6 | 224.9 | 234.7 | 244.9 | 255.5 |
| Depreciation | ||||||||||
| Changes in Account Receivables | ||||||||||
| Changes in Inventories | ||||||||||
| Changes in Accounts Payable | ||||||||||
| Capital Expenditure | ||||||||||
| UFCF | 318.3 | -363.3 | 651.4 | 1,139.1 | 223.4 | 321.2 | 370.0 | 386.0 | 402.8 | 420.3 |
| WACC, % | 6.15 | 6.78 | 4.88 | 5.94 | 6.09 | 5.97 | 5.97 | 5.97 | 5.97 | 5.97 |
| PV UFCF | ||||||||||
| SUM PV UFCF | 1,590.9 | |||||||||
| Long Term Growth Rate, % | 3.50 | |||||||||
| Free cash flow (T + 1) | 435 | |||||||||
| Terminal Value | 17,622 | |||||||||
| Present Terminal Value | 13,187 | |||||||||
| Enterprise Value | 14,778 | |||||||||
| Net Debt | 1,898 | |||||||||
| Equity Value | 12,880 | |||||||||
| Diluted Shares Outstanding, MM | 629 | |||||||||
| Equity Value Per Share | 20.49 |
What You Will Receive
- Adjustable Forecast Parameters: Effortlessly modify variables (growth %, margins, WACC) to explore various scenarios.
- Real-Time Financial Data: Jiajiayue Group's financials pre-loaded to accelerate your analysis.
- Instant DCF Calculations: The template automatically computes Net Present Value (NPV) and intrinsic value for you.
- Tailored and Professional Design: A refined Excel model that fits your valuation requirements.
- Designed for Analysts and Investors: Perfect for evaluating forecasts, confirming strategies, and enhancing efficiency.
Key Features
- Customizable Financial Inputs: Adjust essential parameters such as revenue growth, EBITDA percentage, and capital expenditures.
- Instant DCF Valuation: Quickly calculates intrinsic value, NPV, and other key metrics with ease.
- High-Precision Accuracy: Based on Jiajiayue Group Co., Ltd.'s (603708SS) actual financial data for reliable valuation results.
- Simplified Scenario Analysis: Effortlessly evaluate various assumptions and analyze resulting outcomes.
- Efficiency Boost: Streamline your workflow by avoiding the need to construct complex valuation models from the ground up.
How It Functions
- 1. Access the Template: Download and open the Excel file containing Jiajiayue Group Co., Ltd.'s (603708SS) preloaded information.
- 2. Adjust Key Inputs: Modify essential parameters such as growth rates, WACC, and capital expenditures.
- 3. Analyze Results Immediately: The DCF model automatically computes intrinsic value and NPV in real-time.
- 4. Evaluate Scenarios: Compare various forecasts to assess different valuation possibilities.
- 5. Present with Assurance: Share professional valuation insights to back your strategic decisions.
Why Choose This Calculator for Jiajiayue Group Co., Ltd. (603708SS)?
- User-Friendly Interface: Crafted for both novices and seasoned professionals.
- Customizable Inputs: Effortlessly adjust assumptions to suit your financial analysis.
- Real-Time Updates: Instantly observe changes in Jiajiayue Group's valuation as you tweak the data.
- Pre-Loaded Financials: Comes with Jiajiayue Group's actual financial metrics for immediate insights.
- Relied Upon by Experts: Employed by financial analysts and investors for making well-informed choices.
Who Should Consider This Product?
- Institutional Investors: Develop comprehensive and precise valuation models for analyzing portfolios involving Jiajiayue Group Co., Ltd. (603708SS).
- Corporate Finance Departments: Evaluate valuation scenarios to inform and support strategic decisions within the organization.
- Advisors and Consultants: Deliver clients well-informed insights on the valuation of Jiajiayue Group Co., Ltd. (603708SS).
- Academics and Students: Utilize real-world financial data to enhance learning and practice in financial modeling.
- Market Analysts: Gain insights into how companies like Jiajiayue Group Co., Ltd. (603708SS) are assessed in the competitive landscape.
Contents of the Template
- Comprehensive DCF Model: An editable template featuring detailed valuation calculations specific to Jiajiayue Group Co., Ltd. (603708SS).
- Real-World Data: Preloaded historical and projected financials for Jiajiayue Group to facilitate in-depth analysis.
- Customizable Parameters: Tailor WACC, growth rates, and tax assumptions to explore various scenarios.
- Financial Statements: Complete annual and quarterly financial breakdowns for enhanced insights.
- Key Ratios: Integrated analysis tools for assessing profitability, efficiency, and leverage.
- Dashboard with Visual Outputs: Clear charts and tables that present actionable results for decision-making.
Disclaimer
All information, articles, and product details provided on this website are for general informational and educational purposes only. We do not claim any ownership over, nor do we intend to infringe upon, any trademarks, copyrights, logos, brand names, or other intellectual property mentioned or depicted on this site. Such intellectual property remains the property of its respective owners, and any references here are made solely for identification or informational purposes, without implying any affiliation, endorsement, or partnership.
We make no representations or warranties, express or implied, regarding the accuracy, completeness, or suitability of any content or products presented. Nothing on this website should be construed as legal, tax, investment, financial, medical, or other professional advice. In addition, no part of this site—including articles or product references—constitutes a solicitation, recommendation, endorsement, advertisement, or offer to buy or sell any securities, franchises, or other financial instruments, particularly in jurisdictions where such activity would be unlawful.
All content is of a general nature and may not address the specific circumstances of any individual or entity. It is not a substitute for professional advice or services. Any actions you take based on the information provided here are strictly at your own risk. You accept full responsibility for any decisions or outcomes arising from your use of this website and agree to release us from any liability in connection with your use of, or reliance upon, the content or products found herein.