
|
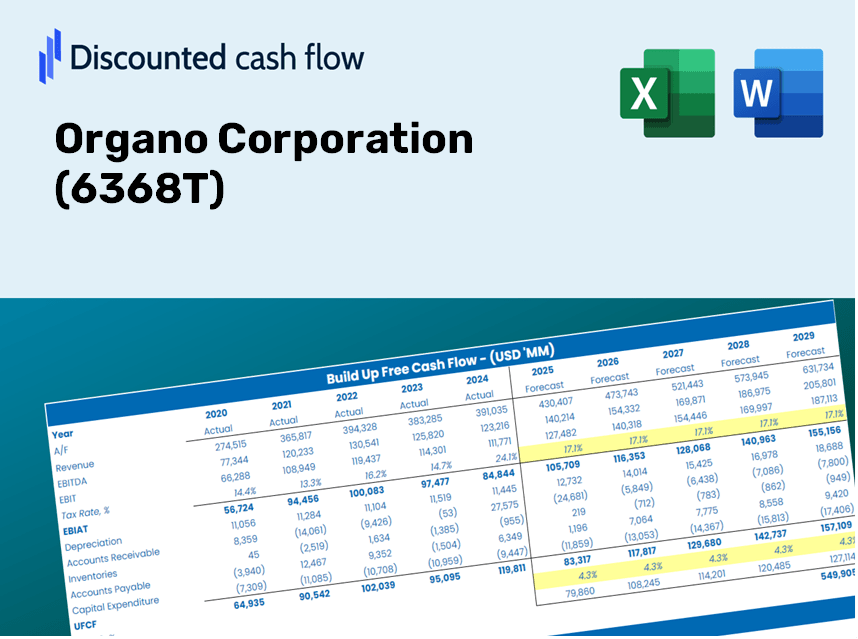
Organo Corporation (6368.T) DCF Valuation |
Totalmente Editável: Adapte-Se Às Suas Necessidades No Excel Ou Planilhas
Design Profissional: Modelos Confiáveis E Padrão Da Indústria
Pré-Construídos Para Uso Rápido E Eficiente
Compatível com MAC/PC, totalmente desbloqueado
Não É Necessária Experiência; Fácil De Seguir
Organo Corporation (6368.T) Bundle
Optimize your time and improve precision with our (6368T) DCF Calculator! Utilizing actual Organo Corporation data and customizable assumptions, this tool enables you to forecast, analyze, and value Organo like a seasoned investor.
Discounted Cash Flow (DCF) - (USD MM)
| Year | AY1 2021 |
AY2 2022 |
AY3 2023 |
AY4 2024 |
AY5 2025 |
FY1 2026 |
FY2 2027 |
FY3 2028 |
FY4 2029 |
FY5 2030 |
|---|---|---|---|---|---|---|---|---|---|---|
| Revenue | 100,638.0 | 112,069.0 | 132,426.0 | 150,356.0 | 163,269.0 | 175,789.5 | 187,826.8 | 199,311.0 | 210,192.6 | 220,439.4 |
| Revenue Growth, % | 0 | 11.36 | 18.16 | 13.54 | 8.59 | 7.67 | 6.85 | 6.11 | 5.46 | 4.87 |
| EBITDA | 11,024.0 | 14,155.0 | 18,018.0 | 25,880.0 | 34,529.0 | 41,233.7 | 48,264.9 | 55,550.3 | 63,020.3 | 70,609.8 |
| EBITDA, % | 10.95 | 12.63 | 13.61 | 17.21 | 21.15 | 23.46 | 25.7 | 27.87 | 29.98 | 32.03 |
| Depreciation | 1,212.0 | 1,332.0 | 1,824.0 | 2,010.0 | 1,925.0 | 2,089.8 | 2,251.3 | 2,408.4 | 2,560.5 | 2,706.9 |
| Depreciation, % | 1.2 | 1.19 | 1.38 | 1.34 | 1.18 | 1.19 | 1.2 | 1.21 | 1.22 | 1.23 |
| EBIT | 9,812.0 | 12,823.0 | 16,194.0 | 23,870.0 | 32,604.0 | 39,149.0 | 46,027.2 | 53,167.5 | 60,501.3 | 67,964.2 |
| EBIT, % | 9.75 | 11.44 | 12.23 | 15.88 | 19.97 | 22.27 | 24.51 | 26.68 | 28.78 | 30.83 |
| Total Cash | 12,804.0 | 20,198.0 | 15,558.0 | 17,642.0 | 16,751.0 | 22,672.4 | 24,224.9 | 25,706.1 | 27,109.5 | 28,431.1 |
| Total Cash, percent | .0 | .0 | .0 | .0 | .0 | .0 | .0 | .0 | .0 | .0 |
| Account Receivables | 60,849.0 | 60,849.0 | 52,926.0 | 105,563.0 | 119,369.0 | 133,863.9 | 148,092.1 | 161,911.3 | 175,207.7 | 187,894.9 |
| Account Receivables, % | 60.46 | 54.3 | 39.97 | 70.21 | 73.11 | 76.15 | 78.85 | 81.24 | 83.36 | 85.24 |
| Inventories | 12,876.0 | 13,455.0 | 30,795.0 | 21,830.0 | 22,524.0 | 25,038.3 | 27,589.3 | 30,159.3 | 32,732.3 | 35,294.5 |
| Inventories, % | 12.79 | 12.01 | 23.25 | 14.52 | 13.8 | 14.24 | 14.69 | 15.13 | 15.57 | 16.01 |
| Accounts Payable | 18,145.0 | 24,370.0 | 25,544.0 | 20,904.0 | 28,086.0 | 31,701.9 | 33,872.7 | 35,943.8 | 37,906.1 | 39,754.1 |
| Accounts Payable, % | 18.03 | 21.75 | 19.29 | 13.9 | 17.2 | 18.03 | 18.03 | 18.03 | 18.03 | 18.03 |
| Capital Expenditure | -1,254.0 | -2,798.0 | -1,452.0 | -1,647.0 | -2,262.0 | -2,573.6 | -2,749.8 | -2,917.9 | -3,077.2 | -3,227.2 |
| Capital Expenditure, % | -1.25 | -2.5 | -1.1 | -1.1 | -1.39 | -1.46 | -1.46 | -1.46 | -1.46 | -1.46 |
| Tax Rate, % | 25.37 | 25.37 | 25.37 | 25.37 | 25.37 | 25.37 | 25.37 | 25.37 | 25.37 | 25.37 |
| EBITAT | 7,159.4 | 9,302.1 | 11,846.3 | 17,483.6 | 24,333.6 | 28,699.3 | 33,741.6 | 38,976.0 | 44,352.2 | 49,823.1 |
| Depreciation | ||||||||||
| Changes in Account Receivables | ||||||||||
| Changes in Inventories | ||||||||||
| Changes in Accounts Payable | ||||||||||
| Capital Expenditure | ||||||||||
| UFCF | -48,462.6 | 13,482.1 | 3,975.3 | -30,465.4 | 16,678.6 | 14,822.2 | 18,634.7 | 24,148.4 | 29,928.4 | 35,901.2 |
| WACC, % | 8.71 | 8.7 | 8.71 | 8.71 | 8.71 | 8.71 | 8.71 | 8.71 | 8.71 | 8.71 |
| PV UFCF | ||||||||||
| SUM PV UFCF | 93,286.8 | |||||||||
| Long Term Growth Rate, % | 2.00 | |||||||||
| Free cash flow (T + 1) | 36,619 | |||||||||
| Terminal Value | 546,083 | |||||||||
| Present Terminal Value | 359,746 | |||||||||
| Enterprise Value | 453,032 | |||||||||
| Net Debt | 5,806 | |||||||||
| Equity Value | 447,226 | |||||||||
| Diluted Shares Outstanding, MM | 46 | |||||||||
| Equity Value Per Share | 9,729.08 |
What You Will Receive
- Authentic Organo Financials: Access to both historical and projected data for precise valuation.
- Customizable Inputs: Adjust key factors such as WACC, tax rates, revenue growth, and capital expenditures.
- Dynamic Calculations: Automatically computes intrinsic value and NPV in real-time.
- Scenario Analysis: Evaluate multiple scenarios to assess Organo Corporation's future performance.
- User-Friendly Design: Tailored for professionals but easy to navigate for newcomers.
Key Features
- Authentic Organo Data: Comes pre-loaded with Organo Corporation's historical financial performance and future estimates.
- Completely Adjustable Inputs: Tailor revenue growth rates, profit margins, WACC, tax percentages, and capital expenditures to suit your analysis.
- Interactive Valuation Framework: Automatically recalculates Net Present Value (NPV) and intrinsic value in response to your input adjustments.
- Scenario Analysis: Generate various forecasting scenarios to explore different potential valuation results.
- Intuitive User Interface: Clean, organized, and crafted for both seasoned professionals and newcomers.
How It Works
- Step 1: Download the Excel file for Organo Corporation (6368T).
- Step 2: Examine the pre-filled financial data and projections for Organo Corporation (6368T).
- Step 3: Adjust key inputs such as revenue growth, WACC, and tax rates (highlighted cells).
- Step 4: Observe the DCF model update in real-time as you modify the assumptions.
- Step 5: Evaluate the outputs and leverage the results for your investment strategies.
Why Choose the Organo Corporation (6368T) Calculator?
- Reliable Data: Utilize authentic Organo Corporation financials for trustworthy valuation insights.
- Flexible Options: Tailor essential parameters such as growth projections, WACC, and tax rates to suit your estimates.
- Efficient: Ready-to-use calculations save you the hassle of starting from the beginning.
- Expert-Level Tool: Crafted for investors, analysts, and consultants in the field.
- Easy to Use: A user-friendly design and clear instructions make it accessible to everyone.
Who Can Benefit from Using Organo Corporation (6368T)?
- Investors: Evaluate Organo Corporation’s valuation prior to making buy or sell decisions with its stock.
- CFOs and Financial Analysts: Optimize the valuation process and validate financial forecasts.
- Startup Founders: Gain insight into how established companies like Organo Corporation are appraised.
- Consultants: Provide comprehensive valuation reports tailored for clients.
- Students and Educators: Utilize real data from Organo Corporation to enhance the learning and application of valuation methods.
What the Template Includes
- Pre-Filled DCF Model: Organo Corporation’s financial data preloaded for immediate application.
- WACC Calculator: Comprehensive calculations for Weighted Average Cost of Capital.
- Financial Ratios: Assess Organo Corporation's profitability, leverage, and operational efficiency.
- Editable Inputs: Modify assumptions such as growth rates, margins, and CAPEX to suit your needs.
- Financial Statements: Access annual and quarterly reports for in-depth analysis.
- Interactive Dashboard: Effortlessly visualize key valuation metrics and outcomes.
Disclaimer
All information, articles, and product details provided on this website are for general informational and educational purposes only. We do not claim any ownership over, nor do we intend to infringe upon, any trademarks, copyrights, logos, brand names, or other intellectual property mentioned or depicted on this site. Such intellectual property remains the property of its respective owners, and any references here are made solely for identification or informational purposes, without implying any affiliation, endorsement, or partnership.
We make no representations or warranties, express or implied, regarding the accuracy, completeness, or suitability of any content or products presented. Nothing on this website should be construed as legal, tax, investment, financial, medical, or other professional advice. In addition, no part of this site—including articles or product references—constitutes a solicitation, recommendation, endorsement, advertisement, or offer to buy or sell any securities, franchises, or other financial instruments, particularly in jurisdictions where such activity would be unlawful.
All content is of a general nature and may not address the specific circumstances of any individual or entity. It is not a substitute for professional advice or services. Any actions you take based on the information provided here are strictly at your own risk. You accept full responsibility for any decisions or outcomes arising from your use of this website and agree to release us from any liability in connection with your use of, or reliance upon, the content or products found herein.