
|
Aeon Financial Service Co., Ltd. (8570.T) Avaliação DCF |
Totalmente Editável: Adapte-Se Às Suas Necessidades No Excel Ou Planilhas
Design Profissional: Modelos Confiáveis E Padrão Da Indústria
Pré-Construídos Para Uso Rápido E Eficiente
Compatível com MAC/PC, totalmente desbloqueado
Não É Necessária Experiência; Fácil De Seguir
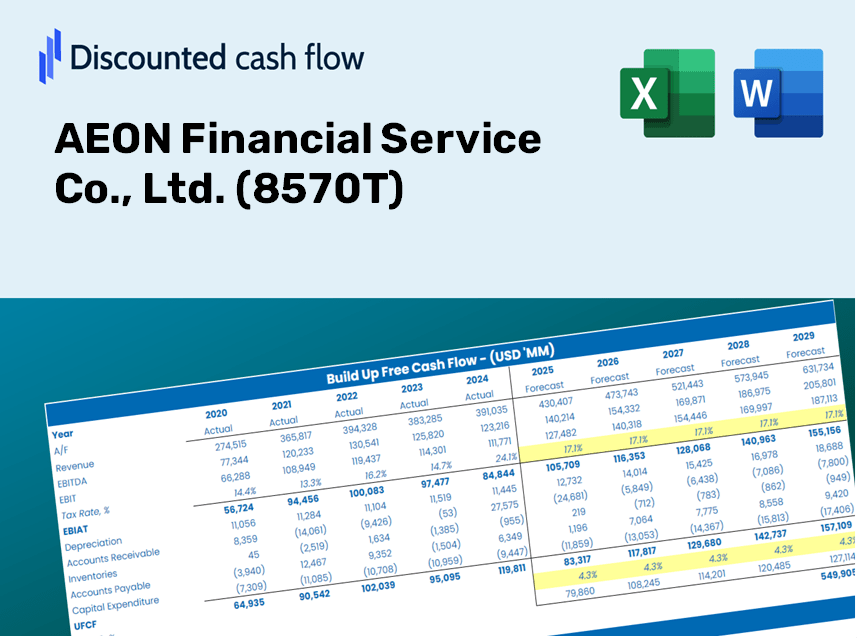
AEON Financial Service Co., Ltd. (8570.T) Bundle
Avalie as perspectivas financeiras da Aeon Financial Service Co., Ltd. Como um especialista! Esta calculadora (8570T) DCF fornece dados financeiros pré-preenchidos e a flexibilidade completa para modificar o crescimento da receita, o WACC, as margens e outras suposições essenciais para se alinhar às suas projeções.
Discounted Cash Flow (DCF) - (USD MM)
| Year | AY1 2020 |
AY2 2021 |
AY3 2022 |
AY4 2023 |
AY5 2024 |
FY1 2025 |
FY2 2026 |
FY3 2027 |
FY4 2028 |
FY5 2029 |
|---|---|---|---|---|---|---|---|---|---|---|
| Revenue | 477,856.0 | 459,159.0 | 412,633.0 | 469,815.0 | 513,334.0 | 524,980.6 | 536,891.5 | 549,072.6 | 561,530.1 | 574,270.2 |
| Revenue Growth, % | 0 | -3.91 | -10.13 | 13.86 | 9.26 | 2.27 | 2.27 | 2.27 | 2.27 | 2.27 |
| EBITDA | 89,868.0 | 108,254.0 | 109,904.0 | 106,728.0 | 125,103.0 | 121,906.4 | 124,672.2 | 127,500.8 | 130,393.6 | 133,352.0 |
| EBITDA, % | 18.81 | 23.58 | 26.63 | 22.72 | 24.37 | 23.22 | 23.22 | 23.22 | 23.22 | 23.22 |
| Depreciation | 31,450.0 | 32,434.0 | 32,098.0 | 32,754.0 | 31,725.0 | 36,303.4 | 37,127.1 | 37,969.4 | 38,830.9 | 39,711.9 |
| Depreciation, % | 6.58 | 7.06 | 7.78 | 6.97 | 6.18 | 6.92 | 6.92 | 6.92 | 6.92 | 6.92 |
| EBIT | 58,418.0 | 75,820.0 | 77,806.0 | 73,974.0 | 93,378.0 | 85,603.0 | 87,545.1 | 89,531.4 | 91,562.7 | 93,640.1 |
| EBIT, % | 12.23 | 16.51 | 18.86 | 15.75 | 18.19 | 16.31 | 16.31 | 16.31 | 16.31 | 16.31 |
| Total Cash | 705,739.0 | 738,782.0 | 842,615.0 | 1,430,112.0 | 1,785,528.0 | 524,980.6 | 536,891.5 | 549,072.6 | 561,530.1 | 574,270.2 |
| Total Cash, percent | .0 | .0 | .0 | .0 | .0 | .0 | .0 | .0 | .0 | .0 |
| Account Receivables | 1,521,149.0 | 4,336,934.0 | 1,769,588.0 | 4,992,452.0 | 5,289,569.0 | 524,980.6 | 536,891.5 | 549,072.6 | 561,530.1 | 574,270.2 |
| Account Receivables, % | 318.33 | 944.54 | 428.85 | 1062.64 | 1030.43 | 100 | 100 | 100 | 100 | 100 |
| Inventories | .0 | 4,241,957.0 | 4,368,706.0 | .0 | .0 | 209,992.3 | 214,756.6 | 219,629.0 | 224,612.0 | 229,708.1 |
| Inventories, % | 0 | 923.85 | 1058.74 | 0 | 0 | 40 | 40 | 40 | 40 | 40 |
| Accounts Payable | 270,015.0 | 225,236.0 | 255,662.0 | 268,536.0 | 317,805.0 | 300,904.2 | 307,731.2 | 314,713.1 | 321,853.4 | 329,155.6 |
| Accounts Payable, % | 56.51 | 49.05 | 61.96 | 57.16 | 61.91 | 57.32 | 57.32 | 57.32 | 57.32 | 57.32 |
| Capital Expenditure | -35,904.0 | -29,062.0 | -33,871.0 | -4,626.0 | -2,622.0 | -24,723.3 | -25,284.2 | -25,857.9 | -26,444.6 | -27,044.5 |
| Capital Expenditure, % | -7.51 | -6.33 | -8.21 | -0.98464 | -0.51078 | -4.71 | -4.71 | -4.71 | -4.71 | -4.71 |
| Tax Rate, % | 60.36 | 60.36 | 60.36 | 60.36 | 60.36 | 60.36 | 60.36 | 60.36 | 60.36 | 60.36 |
| EBITAT | 26,296.6 | 38,340.8 | 39,913.3 | 31,621.6 | 37,010.8 | 39,251.3 | 40,141.9 | 41,052.6 | 41,984.0 | 42,936.6 |
| Depreciation | ||||||||||
| Changes in Account Receivables | ||||||||||
| Changes in Inventories | ||||||||||
| Changes in Accounts Payable | ||||||||||
| Capital Expenditure | ||||||||||
| UFCF | -1,229,291.4 | -7,060,808.2 | 2,509,163.3 | 1,218,465.6 | -181,734.2 | 4,588,526.8 | 42,136.5 | 43,092.5 | 44,070.1 | 45,070.0 |
| WACC, % | 1.83 | 2.02 | 2.05 | 1.75 | 1.63 | 1.86 | 1.86 | 1.86 | 1.86 | 1.86 |
| PV UFCF | ||||||||||
| SUM PV UFCF | 4,668,351.4 | |||||||||
| Long Term Growth Rate, % | 2.00 | |||||||||
| Free cash flow (T + 1) | 45,971 | |||||||||
| Terminal Value | -31,986,253 | |||||||||
| Present Terminal Value | -29,175,907 | |||||||||
| Enterprise Value | -24,507,556 | |||||||||
| Net Debt | 4,701,713 | |||||||||
| Equity Value | -29,209,269 | |||||||||
| Diluted Shares Outstanding, MM | 216 | |||||||||
| Equity Value Per Share | -135,303.89 |
Benefits You Will Receive
- Genuine AEON Financial Data: Preloaded financial metrics – encompassing everything from revenue to EBIT – based on actual and projected data.
- Comprehensive Customization: Modify all key parameters (highlighted cells) such as WACC, growth rates, and tax percentages.
- Immediate Valuation Adjustments: Automatic recalculations to evaluate how changes influence AEON’s fair value.
- Flexible Excel Template: Designed for easy modifications, scenario analysis, and in-depth projections.
- Efficient and Precise: Avoid the hassle of constructing models from scratch while ensuring accuracy and adaptability.
Highlighted Features
- Comprehensive DCF Calculator: Features detailed unlevered and levered DCF valuation models tailored for AEON Financial Service Co., Ltd. (8570T).
- WACC Tool: Pre-configured Weighted Average Cost of Capital sheet with adjustable parameters for your convenience.
- Customizable Forecast Inputs: Adjust growth projections, capital expenditures, and discount rates to suit your analysis.
- Integrated Financial Ratios: Assess profitability, leverage, and efficiency ratios specific to AEON Financial Service Co., Ltd. (8570T).
- Interactive Dashboard and Charts: Visual representations that clearly outline key valuation metrics for straightforward evaluation.
How It Functions
- 1. Access the Template: Download and open the Excel file containing AEON Financial Service Co., Ltd. (8570T) preloaded data.
- 2. Adjust Assumptions: Modify essential inputs such as growth projections, WACC, and capital expenditures.
- 3. View Immediate Results: The DCF model automatically calculates intrinsic value and NPV in real-time.
- 4. Explore Scenarios: Assess various forecasts to examine different valuation results.
- 5. Utilize with Assurance: Present expert valuation insights to bolster your decision-making process.
Reasons to Use AEON Financial Service Co., Ltd. (8570T) Calculator
- Precision: Leverages real AEON financial data for utmost accuracy.
- Versatility: Allows users to easily experiment with and adjust input parameters.
- Efficiency: Eliminate the complexities of creating a DCF model from the ground up.
- High-Quality: Crafted with the expertise and usability expectations of CFOs.
- Accessible: Intuitive design suitable for users with varying levels of financial modeling experience.
Who Should Use AEON Financial Service Co., Ltd. (8570T)?
- Individual Investors: Make well-informed decisions on buying or selling shares of AEON Financial Service Co., Ltd. (8570T).
- Financial Analysts: Enhance valuation processes with intuitive financial models tailored for AEON Financial Service Co., Ltd. (8570T).
- Consultants: Provide clients with accurate and timely valuation insights regarding AEON Financial Service Co., Ltd. (8570T).
- Business Owners: Gain insights into how firms like AEON Financial Service Co., Ltd. (8570T) are valued to inform your strategic planning.
- Finance Students: Explore valuation methodologies using the real-world data and scenarios provided by AEON Financial Service Co., Ltd. (8570T).
Contents of the Template
- Comprehensive DCF Model: An editable template featuring detailed valuation calculations.
- Real-World Data: AEON Financial Service Co., Ltd.'s historical and projected financials preloaded for easy analysis.
- Customizable Parameters: Modify WACC, growth rates, and tax assumptions to explore various scenarios.
- Financial Statements: Complete annual and quarterly breakdowns for enhanced insights.
- Key Ratios: Embedded analysis for profitability, efficiency, and leverage metrics.
- Dashboard with Visual Outputs: Includes charts and tables for clear and actionable results.
Disclaimer
All information, articles, and product details provided on this website are for general informational and educational purposes only. We do not claim any ownership over, nor do we intend to infringe upon, any trademarks, copyrights, logos, brand names, or other intellectual property mentioned or depicted on this site. Such intellectual property remains the property of its respective owners, and any references here are made solely for identification or informational purposes, without implying any affiliation, endorsement, or partnership.
We make no representations or warranties, express or implied, regarding the accuracy, completeness, or suitability of any content or products presented. Nothing on this website should be construed as legal, tax, investment, financial, medical, or other professional advice. In addition, no part of this site—including articles or product references—constitutes a solicitation, recommendation, endorsement, advertisement, or offer to buy or sell any securities, franchises, or other financial instruments, particularly in jurisdictions where such activity would be unlawful.
All content is of a general nature and may not address the specific circumstances of any individual or entity. It is not a substitute for professional advice or services. Any actions you take based on the information provided here are strictly at your own risk. You accept full responsibility for any decisions or outcomes arising from your use of this website and agree to release us from any liability in connection with your use of, or reliance upon, the content or products found herein.