
|
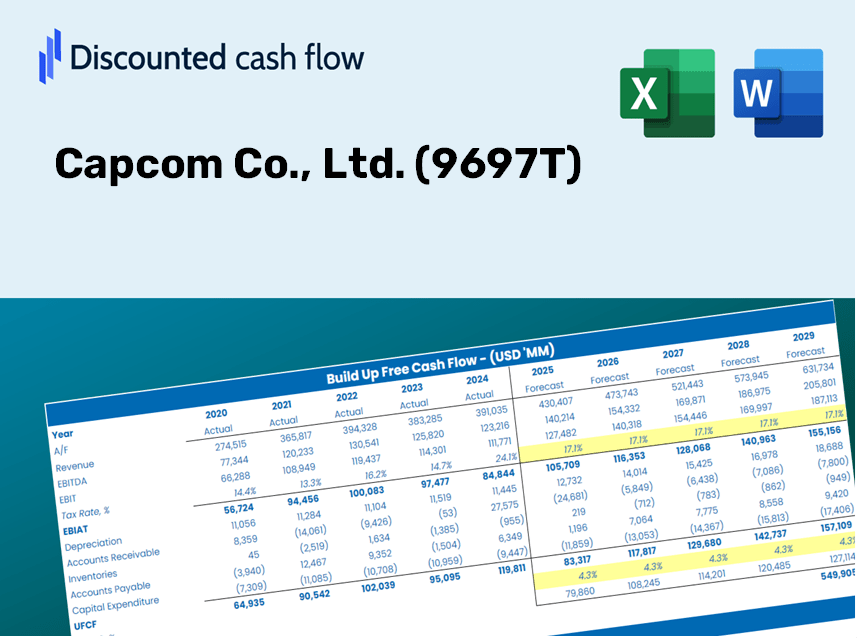
Capcom Co., Ltd. (9697.T) Avaliação DCF |
Totalmente Editável: Adapte-Se Às Suas Necessidades No Excel Ou Planilhas
Design Profissional: Modelos Confiáveis E Padrão Da Indústria
Pré-Construídos Para Uso Rápido E Eficiente
Compatível com MAC/PC, totalmente desbloqueado
Não É Necessária Experiência; Fácil De Seguir
Capcom Co., Ltd. (9697.T) Bundle
Seja você um investidor ou analista, a calculadora DCF da Capcom Co., Ltd. (9697T) é sua ferramenta preferida para uma avaliação precisa. Pré -carregado com dados reais da Capcom, você pode ajustar as previsões e observar instantaneamente os efeitos.
What You Will Receive
- Accurate Capcom Financials: Access to historical and projected data for precise valuation.
- Customizable Inputs: Adjust WACC, tax rates, revenue growth, and capital expenditures as needed.
- Automated Calculations: Intrinsic value and NPV are computed in real-time.
- Scenario Analysis: Examine various scenarios to assess Capcom's future performance.
- User-Friendly Design: Designed for professionals while remaining approachable for newcomers.
Key Features
- Real-Life Capcom Data: Pre-filled with Capcom’s historical financial performance and future projections.
- Fully Customizable Inputs: Adjust revenue growth, profit margins, discount rates, tax rates, and capital expenditures.
- Dynamic Valuation Model: Automatic updates to Net Present Value (NPV) and intrinsic value based on your parameters.
- Scenario Testing: Develop multiple forecasting scenarios to evaluate various valuation outcomes.
- User-Friendly Design: Intuitive and structured, suitable for both professionals and newcomers.
How It Functions
- Step 1: Download the Excel spreadsheet.
- Step 2: Examine the pre-filled Capcom data (historical and projected).
- Step 3: Modify the key assumptions (highlighted in yellow) according to your insights.
- Step 4: Observe the automatic updates for Capcom’s intrinsic value.
- Step 5: Apply the results for your investment strategies or reporting needs.
Why Choose the Capcom (9697T) Calculator?
- Precision: Leverage authentic Capcom financials for reliable data.
- Versatility: Tailored for users to easily adjust and experiment with inputs.
- Efficiency: Avoid the complexities of constructing a DCF model from the ground up.
- Expert-Level: Crafted with the accuracy and usability standards of CFOs.
- Intuitive: Designed to be accessible for users with varying levels of financial modeling expertise.
Who Should Consider Using This Product?
- Individual Investors: Gain insights for informed trading decisions regarding Capcom Co., Ltd. (9697T) stock.
- Financial Analysts: Enhance valuation methodologies with comprehensive financial models tailored for Capcom Co., Ltd. (9697T).
- Consultants: Provide timely and precise valuation analyses to clients focusing on the gaming industry.
- Game Developers: Learn how major companies like Capcom Co., Ltd. (9697T) are valued to better position your own projects.
- Finance Students: Explore real-world valuation techniques using data and case studies from Capcom Co., Ltd. (9697T).
What the Template Contains
- Historical Data: Includes Capcom’s past financial performance and baseline forecasts.
- DCF and Levered DCF Models: Comprehensive templates for assessing Capcom’s intrinsic value.
- WACC Sheet: Pre-calculated metrics for the Weighted Average Cost of Capital.
- Editable Inputs: Adjust key parameters such as growth rates, EBITDA %, and CAPEX estimates.
- Quarterly and Annual Statements: Detailed breakdown of Capcom’s financial data.
- Interactive Dashboard: Dynamically visualize valuation outcomes and future projections.
Disclaimer
All information, articles, and product details provided on this website are for general informational and educational purposes only. We do not claim any ownership over, nor do we intend to infringe upon, any trademarks, copyrights, logos, brand names, or other intellectual property mentioned or depicted on this site. Such intellectual property remains the property of its respective owners, and any references here are made solely for identification or informational purposes, without implying any affiliation, endorsement, or partnership.
We make no representations or warranties, express or implied, regarding the accuracy, completeness, or suitability of any content or products presented. Nothing on this website should be construed as legal, tax, investment, financial, medical, or other professional advice. In addition, no part of this site—including articles or product references—constitutes a solicitation, recommendation, endorsement, advertisement, or offer to buy or sell any securities, franchises, or other financial instruments, particularly in jurisdictions where such activity would be unlawful.
All content is of a general nature and may not address the specific circumstances of any individual or entity. It is not a substitute for professional advice or services. Any actions you take based on the information provided here are strictly at your own risk. You accept full responsibility for any decisions or outcomes arising from your use of this website and agree to release us from any liability in connection with your use of, or reliance upon, the content or products found herein.