
|
Abbott India Limited (Abbotindia.NS) Avaliação DCF |
Totalmente Editável: Adapte-Se Às Suas Necessidades No Excel Ou Planilhas
Design Profissional: Modelos Confiáveis E Padrão Da Indústria
Pré-Construídos Para Uso Rápido E Eficiente
Compatível com MAC/PC, totalmente desbloqueado
Não É Necessária Experiência; Fácil De Seguir
Abbott India Limited (ABBOTINDIA.NS) Bundle
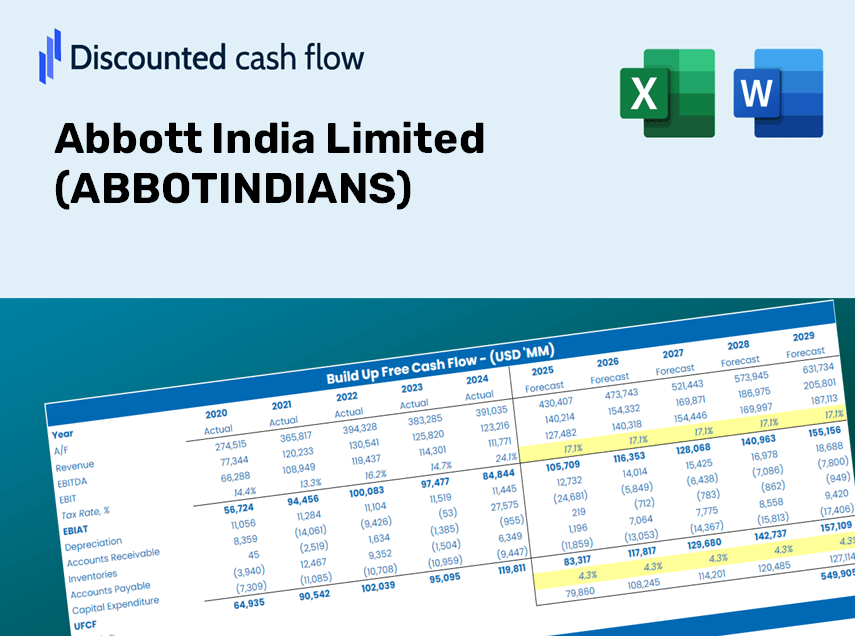
Projetado para precisão, nossa calculadora DCF (Abbotindians) o capacita a avaliar a avaliação da Abbott India Limited usando dados financeiros do mundo real, oferecendo flexibilidade completa para modificar todos os parâmetros essenciais para melhorar a previsão.
Discounted Cash Flow (DCF) - (USD MM)
| Year | AY1 2021 |
AY2 2022 |
AY3 2023 |
AY4 2024 |
AY5 2025 |
FY1 2026 |
FY2 2027 |
FY3 2028 |
FY4 2029 |
FY5 2030 |
|---|---|---|---|---|---|---|---|---|---|---|
| Revenue | 43,075.9 | 49,103.0 | 53,467.3 | 58,471.9 | 64,091.5 | 70,797.2 | 78,204.5 | 86,386.8 | 95,425.2 | 105,409.2 |
| Revenue Growth, % | 0 | 13.99 | 8.89 | 9.36 | 9.61 | 10.46 | 10.46 | 10.46 | 10.46 | 10.46 |
| EBITDA | 9,982.6 | 11,612.5 | 13,560.3 | 16,978.0 | 19,701.8 | 18,685.1 | 20,640.0 | 22,799.5 | 25,185.0 | 27,820.0 |
| EBITDA, % | 23.17 | 23.65 | 25.36 | 29.04 | 30.74 | 26.39 | 26.39 | 26.39 | 26.39 | 26.39 |
| Depreciation | 581.3 | 661.0 | 699.7 | 711.7 | 718.0 | 898.0 | 991.9 | 1,095.7 | 1,210.3 | 1,337.0 |
| Depreciation, % | 1.35 | 1.35 | 1.31 | 1.22 | 1.12 | 1.27 | 1.27 | 1.27 | 1.27 | 1.27 |
| EBIT | 9,401.3 | 10,951.5 | 12,860.6 | 16,266.3 | 18,983.8 | 17,787.1 | 19,648.1 | 21,703.8 | 23,974.6 | 26,483.0 |
| EBIT, % | 21.82 | 22.3 | 24.05 | 27.82 | 29.62 | 25.12 | 25.12 | 25.12 | 25.12 | 25.12 |
| Total Cash | 23,975.0 | 27,351.8 | 19,224.0 | 21,179.9 | 31,131.8 | 32,865.7 | 36,304.3 | 40,102.7 | 44,298.6 | 48,933.4 |
| Total Cash, percent | .0 | .0 | .0 | .0 | .0 | .0 | .0 | .0 | .0 | .0 |
| Account Receivables | 3,548.6 | 3,886.1 | 4,259.3 | 3,943.6 | 7,101.6 | 5,938.9 | 6,560.3 | 7,246.7 | 8,004.9 | 8,842.4 |
| Account Receivables, % | 8.24 | 7.91 | 7.97 | 6.74 | 11.08 | 8.39 | 8.39 | 8.39 | 8.39 | 8.39 |
| Inventories | 7,175.9 | 6,878.2 | 6,488.5 | 6,195.8 | 8,820.4 | 9,509.5 | 10,504.5 | 11,603.5 | 12,817.6 | 14,158.6 |
| Inventories, % | 16.66 | 14.01 | 12.14 | 10.6 | 13.76 | 13.43 | 13.43 | 13.43 | 13.43 | 13.43 |
| Accounts Payable | 7,626.7 | 8,894.5 | 8,919.9 | 10,026.9 | 10,578.6 | 12,199.2 | 13,475.5 | 14,885.4 | 16,442.9 | 18,163.2 |
| Accounts Payable, % | 17.71 | 18.11 | 16.68 | 17.15 | 16.51 | 17.23 | 17.23 | 17.23 | 17.23 | 17.23 |
| Capital Expenditure | -233.1 | -440.7 | -341.1 | -483.3 | -526.0 | -527.3 | -582.4 | -643.4 | -710.7 | -785.1 |
| Capital Expenditure, % | -0.54114 | -0.8975 | -0.63796 | -0.82655 | -0.8207 | -0.74477 | -0.74477 | -0.74477 | -0.74477 | -0.74477 |
| Tax Rate, % | 25.04 | 25.04 | 25.04 | 25.04 | 25.04 | 25.04 | 25.04 | 25.04 | 25.04 | 25.04 |
| EBITAT | 7,012.7 | 8,101.1 | 9,585.3 | 12,078.1 | 14,230.1 | 13,244.6 | 14,630.3 | 16,161.1 | 17,851.9 | 19,719.7 |
| Depreciation | ||||||||||
| Changes in Account Receivables | ||||||||||
| Changes in Inventories | ||||||||||
| Changes in Accounts Payable | ||||||||||
| Capital Expenditure | ||||||||||
| UFCF | 4,263.1 | 9,549.4 | 9,985.8 | 14,021.9 | 9,191.2 | 15,709.4 | 14,699.8 | 16,237.8 | 17,936.7 | 19,813.4 |
| WACC, % | 4.68 | 4.68 | 4.68 | 4.68 | 4.68 | 4.68 | 4.68 | 4.68 | 4.68 | 4.68 |
| PV UFCF | ||||||||||
| SUM PV UFCF | 73,272.6 | |||||||||
| Long Term Growth Rate, % | 4.00 | |||||||||
| Free cash flow (T + 1) | 20,606 | |||||||||
| Terminal Value | 3,017,473 | |||||||||
| Present Terminal Value | 2,400,297 | |||||||||
| Enterprise Value | 2,473,569 | |||||||||
| Net Debt | -3,639 | |||||||||
| Equity Value | 2,477,209 | |||||||||
| Diluted Shares Outstanding, MM | 21 | |||||||||
| Equity Value Per Share | 116,574.52 |
What You Will Receive
- Adjustable Forecast Inputs: Seamlessly modify assumptions (growth %, margins, WACC) to develop various scenarios.
- Comprehensive Data: Abbott India Limited's (ABBOTINDIANS) financial information is pre-loaded to facilitate your analysis.
- Instant DCF Outputs: The template computes Net Present Value (NPV) and intrinsic value automatically.
- Tailored and Professional: A refined Excel model that caters to your valuation requirements.
- Designed for Analysts and Investors: Perfect for testing projections, validating strategies, and enhancing efficiency.
Key Highlights
- Comprehensive Abbott Financials: Gain access to precise pre-loaded historical data and future forecasts.
- Personalized Forecast Parameters: Modify the highlighted cells for variables like WACC, growth rates, and profit margins.
- Real-Time Calculations: Automatic updates for DCF, Net Present Value (NPV), and cash flow analysis.
- Interactive Dashboard: User-friendly charts and summaries to clearly present your valuation outcomes.
- Designed for All Skill Levels: An intuitive layout tailored for investors, CFOs, and consultants alike.
How It Works
- Download: Obtain the ready-to-use Excel file containing Abbott India Limited’s (ABBOTINDIANS) financial data.
- Customize: Tailor forecasts, including revenue growth, EBITDA %, and WACC according to your needs.
- Update Automatically: Watch as intrinsic value and NPV calculations refresh in real-time.
- Test Scenarios: Generate various projections and instantly compare the results.
- Make Decisions: Leverage the valuation results to inform your investment choices.
Why Choose This Calculator for Abbott India Limited (ABBOTINDIANS)?
- All-in-One Solution: Combines DCF, WACC, and financial ratio analyses in a single tool.
- Flexible Inputs: Modify yellow-highlighted fields to explore different scenarios.
- In-Depth Analysis: Automatically computes Abbott India’s intrinsic value and Net Present Value.
- Preloaded Information: Includes both historical and projected data for reliable starting references.
- High-Quality Standards: Tailored for financial analysts, investors, and business consultants.
Who Can Benefit from Abbott India Limited (ABBOTINDIANS)?
- Institutional Investors: Develop comprehensive and trustworthy valuation models for investment portfolios.
- Corporate Finance Departments: Evaluate valuation scenarios to inform strategic decisions.
- Financial Consultants and Advisors: Deliver precise valuation analyses for clients interested in Abbott India Limited (ABBOTINDIANS).
- Students and Academics: Utilize real market data for practicing and teaching financial modeling techniques.
- Healthcare Sector Enthusiasts: Gain insights into how companies like Abbott India Limited (ABBOTINDIANS) are appraised in the financial landscape.
Contents of the Template
- Comprehensive DCF Model: Editable template featuring detailed valuation calculations.
- Real-World Data: Abbott India Limited’s historical and projected financials preloaded for in-depth analysis.
- Customizable Parameters: Modify WACC, growth rates, and tax assumptions to explore various scenarios.
- Financial Statements: Complete annual and quarterly breakdowns for enhanced insights.
- Key Ratios: Integrated analysis of profitability, efficiency, and leverage.
- Dashboard with Visual Outputs: Charts and tables that present clear, actionable results.
Disclaimer
All information, articles, and product details provided on this website are for general informational and educational purposes only. We do not claim any ownership over, nor do we intend to infringe upon, any trademarks, copyrights, logos, brand names, or other intellectual property mentioned or depicted on this site. Such intellectual property remains the property of its respective owners, and any references here are made solely for identification or informational purposes, without implying any affiliation, endorsement, or partnership.
We make no representations or warranties, express or implied, regarding the accuracy, completeness, or suitability of any content or products presented. Nothing on this website should be construed as legal, tax, investment, financial, medical, or other professional advice. In addition, no part of this site—including articles or product references—constitutes a solicitation, recommendation, endorsement, advertisement, or offer to buy or sell any securities, franchises, or other financial instruments, particularly in jurisdictions where such activity would be unlawful.
All content is of a general nature and may not address the specific circumstances of any individual or entity. It is not a substitute for professional advice or services. Any actions you take based on the information provided here are strictly at your own risk. You accept full responsibility for any decisions or outcomes arising from your use of this website and agree to release us from any liability in connection with your use of, or reliance upon, the content or products found herein.