
|
Avaliação DCF de Capital Associated Capital Group, Inc. (AC) |
Totalmente Editável: Adapte-Se Às Suas Necessidades No Excel Ou Planilhas
Design Profissional: Modelos Confiáveis E Padrão Da Indústria
Pré-Construídos Para Uso Rápido E Eficiente
Compatível com MAC/PC, totalmente desbloqueado
Não É Necessária Experiência; Fácil De Seguir
Associated Capital Group, Inc. (AC) Bundle
Procurando determinar o valor intrínseco do Associated Capital Group, Inc.? Nossa calculadora DCF (AC) integra dados do mundo real com extensos recursos de personalização, permitindo refinar suas previsões e aprimorar suas estratégias de investimento.
What You Will Get
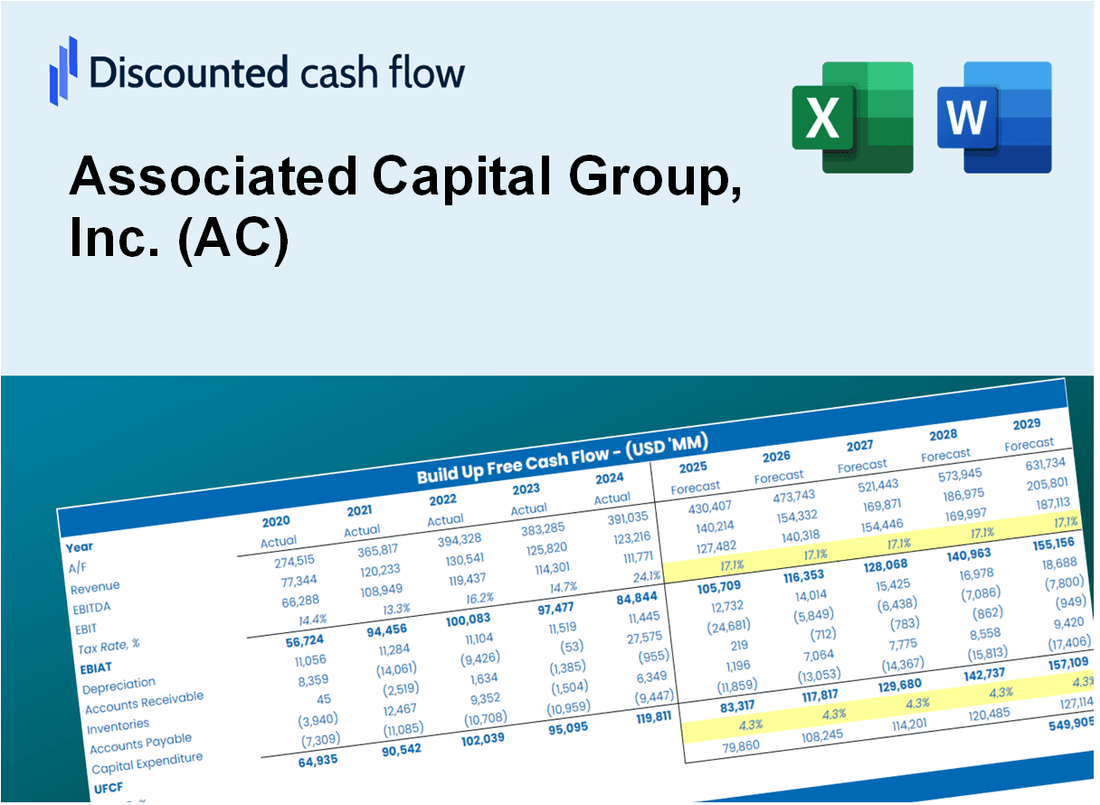
- Editable Excel Template: A fully customizable Excel-based DCF Calculator featuring pre-filled real AC financials.
- Real-World Data: Access to historical data and forward-looking estimates (highlighted in the yellow cells).
- Forecast Flexibility: Modify forecast assumptions such as revenue growth, EBITDA %, and WACC.
- Automatic Calculations: Instantly observe how your inputs affect the valuation of Associated Capital Group, Inc. (AC).
- Professional Tool: Designed for investors, CFOs, consultants, and financial analysts.
- User-Friendly Design: Organized for clarity and ease of use, complete with step-by-step instructions.
Key Features
- Comprehensive DCF Calculator: Features detailed unlevered and levered DCF valuation models tailored for Associated Capital Group, Inc. (AC).
- WACC Calculator: Pre-configured Weighted Average Cost of Capital sheet with adjustable inputs specific to AC.
- Customizable Forecast Assumptions: Adjust growth rates, capital expenditures, and discount rates to fit your analysis needs.
- Integrated Financial Ratios: Evaluate profitability, leverage, and efficiency ratios pertinent to Associated Capital Group, Inc. (AC).
- Interactive Dashboard and Charts: Visual representations summarize essential valuation metrics for streamlined analysis.
How It Works
- Download: Obtain the pre-configured Excel file containing Associated Capital Group, Inc. (AC)'s financial data.
- Customize: Modify projections such as revenue growth, EBITDA %, and WACC to fit your analysis.
- Update Automatically: Watch as intrinsic value and NPV calculations refresh in real-time.
- Test Scenarios: Develop various forecasts and instantly compare their results.
- Make Decisions: Leverage the valuation outputs to inform your investment choices.
Why Choose This Calculator for Associated Capital Group, Inc. (AC)?
- Designed for Experts: A sophisticated tool favored by financial analysts, CFOs, and industry consultants.
- Accurate Financial Data: Associated Capital Group’s historical and projected financials are preloaded for precise calculations.
- Flexible Scenario Analysis: Effortlessly simulate various forecasts and assumptions.
- Comprehensive Outputs: Instantly calculates intrinsic value, NPV, and essential financial metrics.
- User-Friendly Interface: Step-by-step guidance ensures a smooth experience throughout the process.
Who Should Use Associated Capital Group, Inc. (AC)?
- Investors: Gain insights and make informed decisions with our expert investment strategies.
- Financial Analysts: Streamline your analysis process with our comprehensive financial tools and resources.
- Consultants: Effortlessly tailor our solutions for impactful client presentations and reports.
- Finance Enthusiasts: Enhance your knowledge of investment strategies and market trends with our educational materials.
- Educators and Students: Utilize our resources as a hands-on learning tool in finance and investment courses.
What the Template Contains
- Preloaded AC Data: Historical and projected financial data, including revenue, EBIT, and capital expenditures.
- DCF and WACC Models: Professional-grade sheets for calculating intrinsic value and Weighted Average Cost of Capital.
- Editable Inputs: Yellow-highlighted cells for adjusting revenue growth, tax rates, and discount rates.
- Financial Statements: Comprehensive annual and quarterly financials for deeper analysis.
- Key Ratios: Profitability, leverage, and efficiency ratios to evaluate performance.
- Dashboard and Charts: Visual summaries of valuation outcomes and assumptions.
Disclaimer
All information, articles, and product details provided on this website are for general informational and educational purposes only. We do not claim any ownership over, nor do we intend to infringe upon, any trademarks, copyrights, logos, brand names, or other intellectual property mentioned or depicted on this site. Such intellectual property remains the property of its respective owners, and any references here are made solely for identification or informational purposes, without implying any affiliation, endorsement, or partnership.
We make no representations or warranties, express or implied, regarding the accuracy, completeness, or suitability of any content or products presented. Nothing on this website should be construed as legal, tax, investment, financial, medical, or other professional advice. In addition, no part of this site—including articles or product references—constitutes a solicitation, recommendation, endorsement, advertisement, or offer to buy or sell any securities, franchises, or other financial instruments, particularly in jurisdictions where such activity would be unlawful.
All content is of a general nature and may not address the specific circumstances of any individual or entity. It is not a substitute for professional advice or services. Any actions you take based on the information provided here are strictly at your own risk. You accept full responsibility for any decisions or outcomes arising from your use of this website and agree to release us from any liability in connection with your use of, or reliance upon, the content or products found herein.