
|
Portos Adani e Zona Econômica Especial Limited (Adaniports.NS) Avaliação DCF |
Totalmente Editável: Adapte-Se Às Suas Necessidades No Excel Ou Planilhas
Design Profissional: Modelos Confiáveis E Padrão Da Indústria
Pré-Construídos Para Uso Rápido E Eficiente
Compatível com MAC/PC, totalmente desbloqueado
Não É Necessária Experiência; Fácil De Seguir
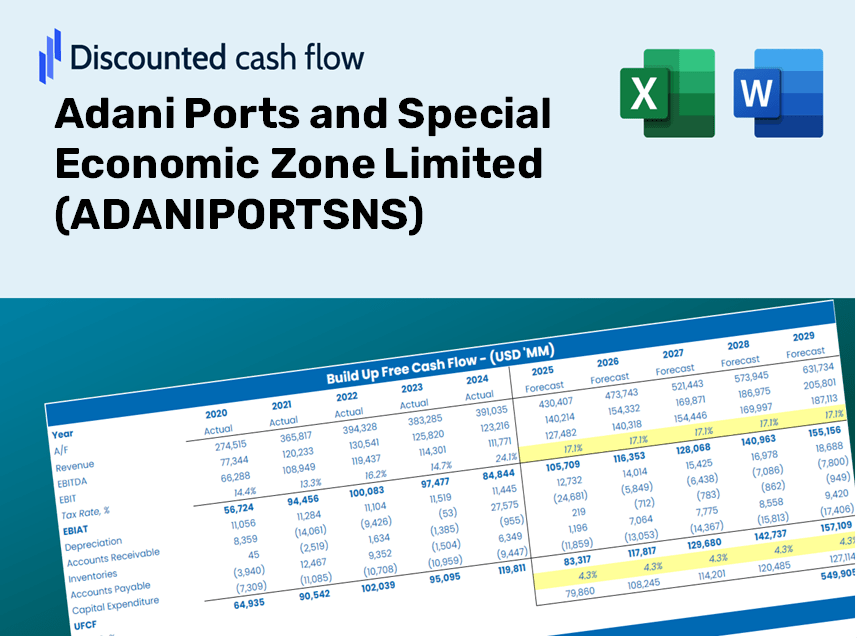
Adani Ports and Special Economic Zone Limited (ADANIPORTS.NS) Bundle
Simplifique as portas Adani e a Avaliação Especial da Zona Econômica Limitada (Adaniportsns) com esta calculadora DCF personalizável! Apresentando portos adani reais e a Zona Econômica Especial Limited (Adaniportsns) financeiras e insumos de previsão ajustáveis, você pode testar cenários e descobrir portos de Adani e o valor justo da Zona Econômica Especial (Adaniportsns) em minutos.
Discounted Cash Flow (DCF) - (USD MM)
| Year | AY1 2021 |
AY2 2022 |
AY3 2023 |
AY4 2024 |
AY5 2025 |
FY1 2026 |
FY2 2027 |
FY3 2028 |
FY4 2029 |
FY5 2030 |
|---|---|---|---|---|---|---|---|---|---|---|
| Revenue | 125,496.0 | 171,187.9 | 208,519.1 | 267,105.6 | 304,753.3 | 381,252.0 | 476,953.2 | 596,677.3 | 746,454.2 | 933,828.0 |
| Revenue Growth, % | 0 | 36.41 | 21.81 | 28.1 | 14.09 | 25.1 | 25.1 | 25.1 | 25.1 | 25.1 |
| EBITDA | 79,022.5 | 103,655.4 | 126,517.8 | 156,640.4 | 180,933.2 | 230,434.2 | 288,277.4 | 360,640.4 | 451,167.8 | 564,419.2 |
| EBITDA, % | 62.97 | 60.55 | 60.67 | 58.64 | 59.37 | 60.44 | 60.44 | 60.44 | 60.44 | 60.44 |
| Depreciation | 19,984.4 | 29,629.9 | 31,866.4 | 36,358.4 | 40,494.1 | 57,503.8 | 71,938.4 | 89,996.2 | 112,586.9 | 140,848.3 |
| Depreciation, % | 15.92 | 17.31 | 15.28 | 13.61 | 13.29 | 15.08 | 15.08 | 15.08 | 15.08 | 15.08 |
| EBIT | 59,038.1 | 74,025.5 | 94,651.4 | 120,282.0 | 140,439.1 | 172,930.4 | 216,339.1 | 270,644.2 | 338,580.8 | 423,570.8 |
| EBIT, % | 47.04 | 43.24 | 45.39 | 45.03 | 46.08 | 45.36 | 45.36 | 45.36 | 45.36 | 45.36 |
| Total Cash | 58,310.8 | 93,244.6 | 63,531.3 | 49,810.7 | 60,983.4 | 129,671.7 | 162,221.7 | 202,942.3 | 253,884.5 | 317,614.2 |
| Total Cash, percent | .0 | .0 | .0 | .0 | .0 | .0 | .0 | .0 | .0 | .0 |
| Account Receivables | 49,999.2 | 46,604.3 | 55,629.2 | 47,267.6 | 55,134.6 | 98,768.2 | 123,560.8 | 154,576.8 | 193,378.4 | 241,920.0 |
| Account Receivables, % | 39.84 | 27.22 | 26.68 | 17.7 | 18.09 | 25.91 | 25.91 | 25.91 | 25.91 | 25.91 |
| Inventories | 9,918.5 | 3,956.4 | 4,519.7 | 4,375.1 | 5,218.0 | 11,995.9 | 15,007.1 | 18,774.2 | 23,486.9 | 29,382.5 |
| Inventories, % | 7.9 | 2.31 | 2.17 | 1.64 | 1.71 | 3.15 | 3.15 | 3.15 | 3.15 | 3.15 |
| Accounts Payable | 28,036.9 | 23,635.4 | 41,515.0 | 42,178.8 | 61,278.4 | 70,116.5 | 87,717.1 | 109,735.7 | 137,281.3 | 171,741.5 |
| Accounts Payable, % | 22.34 | 13.81 | 19.91 | 15.79 | 20.11 | 18.39 | 18.39 | 18.39 | 18.39 | 18.39 |
| Capital Expenditure | -23,517.0 | -37,491.7 | -91,247.8 | -74,163.0 | -80,489.2 | -105,665.3 | -132,189.3 | -165,371.2 | -206,882.4 | -258,813.7 |
| Capital Expenditure, % | -18.74 | -21.9 | -43.76 | -27.77 | -26.41 | -27.72 | -27.72 | -27.72 | -27.72 | -27.72 |
| Tax Rate, % | 14.87 | 14.87 | 14.87 | 14.87 | 14.87 | 14.87 | 14.87 | 14.87 | 14.87 | 14.87 |
| EBITAT | 46,861.7 | 63,264.3 | 91,580.1 | 96,650.5 | 119,557.9 | 147,709.5 | 184,787.3 | 231,172.4 | 289,200.9 | 361,795.6 |
| Depreciation | ||||||||||
| Changes in Account Receivables | ||||||||||
| Changes in Inventories | ||||||||||
| Changes in Accounts Payable | ||||||||||
| Capital Expenditure | ||||||||||
| UFCF | 11,448.3 | 60,358.0 | 40,490.1 | 68,015.9 | 89,952.5 | 57,974.7 | 114,333.1 | 143,032.9 | 178,936.8 | 223,853.2 |
| WACC, % | 5.27 | 5.32 | 5.4 | 5.28 | 5.32 | 5.32 | 5.32 | 5.32 | 5.32 | 5.32 |
| PV UFCF | ||||||||||
| SUM PV UFCF | 598,768.9 | |||||||||
| Long Term Growth Rate, % | 4.00 | |||||||||
| Free cash flow (T + 1) | 232,807 | |||||||||
| Terminal Value | 17,662,003 | |||||||||
| Present Terminal Value | 13,630,895 | |||||||||
| Enterprise Value | 14,229,664 | |||||||||
| Net Debt | 448,482 | |||||||||
| Equity Value | 13,781,182 | |||||||||
| Diluted Shares Outstanding, MM | 2,160 | |||||||||
| Equity Value Per Share | 6,379.77 |
What You Will Receive
- Authentic ADANIPORTSNS Financials: Access to both historical and projected data for precise valuation.
- Customizable Inputs: Adjust WACC, tax rates, revenue growth, and capital expenditures as needed.
- Instant Calculations: Dynamic computation of intrinsic value and NPV.
- Scenario Analysis: Evaluate various scenarios to assess the future performance of Adani Ports.
- User-Friendly and Elegant Design: Tailored for professionals but approachable for newcomers.
Key Features
- Authentic ADANIPORTSNS Data: Pre-loaded with Adani Ports' historical financials and future growth forecasts.
- Completely Customizable Inputs: Tailor revenue growth, profit margins, WACC, tax rates, and capital expenditure parameters.
- Interactive Valuation Model: Automatically refreshes Net Present Value (NPV) and intrinsic value based on your adjustments.
- Scenario Analysis: Generate various forecast scenarios to evaluate different valuation results.
- Intuitive Interface: Easy-to-navigate design suitable for both professionals and newcomers.
How It Operates
- Download the Template: Gain immediate access to the Excel-based DCF Calculator for Adani Ports and Special Economic Zone Limited (ADANIPORTSNS).
- Input Your Assumptions: Modify the yellow-highlighted cells for growth projections, WACC, profit margins, and other variables.
- Instant Calculations: The model automatically refreshes to provide the intrinsic value of Adani Ports.
- Test Scenarios: Experiment with various assumptions to assess potential changes in valuation.
- Analyze and Decide: Utilize the results to inform your investment strategy or financial analysis.
Why Opt for This Calculator?
- Tailored for Experts: A sophisticated tool designed for analysts, CFOs, and consultants in the industry.
- Accurate Financials: Historical and projected data for Adani Ports and Special Economic Zone Limited (ADANIPORTSNS) pre-included for precision.
- Customizable Scenarios: Effortlessly test various forecasts and assumptions.
- Concise Outputs: Instant calculations of intrinsic value, NPV, and essential metrics.
- User-Friendly: Detailed step-by-step guidance to help you navigate the process.
Who Can Benefit from This Product?
- Investors: Evaluate the valuation of Adani Ports and Special Economic Zone Limited (ADANIPORTSNS) before making trading decisions.
- CFOs and Financial Analysts: Optimize valuation methodologies and assess financial forecasts.
- Startup Founders: Gain insights into how large firms like Adani Ports are valued in the market.
- Consultants: Provide detailed valuation reports tailored for your clients.
- Students and Educators: Utilize real market data to explore and teach valuation strategies.
Contents of the Template
- Preloaded ADANIPORTSNS Data: Historical and projected financial metrics, including revenue, EBIT, and capital expenditures.
- DCF and WACC Models: Advanced spreadsheets for determining intrinsic value and Weighted Average Cost of Capital.
- Editable Inputs: Cells highlighted in yellow for customization of revenue growth, tax rates, and discount rates.
- Financial Statements: Detailed annual and quarterly financial reports for in-depth analysis.
- Key Ratios: Metrics for profitability, leverage, and efficiency to assess performance.
- Dashboard and Charts: Visual representations of valuation results and underlying assumptions.
Disclaimer
All information, articles, and product details provided on this website are for general informational and educational purposes only. We do not claim any ownership over, nor do we intend to infringe upon, any trademarks, copyrights, logos, brand names, or other intellectual property mentioned or depicted on this site. Such intellectual property remains the property of its respective owners, and any references here are made solely for identification or informational purposes, without implying any affiliation, endorsement, or partnership.
We make no representations or warranties, express or implied, regarding the accuracy, completeness, or suitability of any content or products presented. Nothing on this website should be construed as legal, tax, investment, financial, medical, or other professional advice. In addition, no part of this site—including articles or product references—constitutes a solicitation, recommendation, endorsement, advertisement, or offer to buy or sell any securities, franchises, or other financial instruments, particularly in jurisdictions where such activity would be unlawful.
All content is of a general nature and may not address the specific circumstances of any individual or entity. It is not a substitute for professional advice or services. Any actions you take based on the information provided here are strictly at your own risk. You accept full responsibility for any decisions or outcomes arising from your use of this website and agree to release us from any liability in connection with your use of, or reliance upon, the content or products found herein.