
|
Avaliação Federal da Agricultural Mortgage Corporation (AGM) DCF |
Totalmente Editável: Adapte-Se Às Suas Necessidades No Excel Ou Planilhas
Design Profissional: Modelos Confiáveis E Padrão Da Indústria
Pré-Construídos Para Uso Rápido E Eficiente
Compatível com MAC/PC, totalmente desbloqueado
Não É Necessária Experiência; Fácil De Seguir
Federal Agricultural Mortgage Corporation (AGM) Bundle
Avalie as perspectivas financeiras da Federal Agricultural Mortgage Corporation (AGM) como um especialista! Esta calculadora DCF (AGM) oferece finanças pré-preenchidas e permite modificar facilmente o crescimento da receita, o WACC, as margens e outras suposições essenciais para se alinhar com suas previsões.
What You Will Receive
- Customizable Excel Template: A fully editable Excel-based DCF Calculator featuring pre-filled real AGM financials.
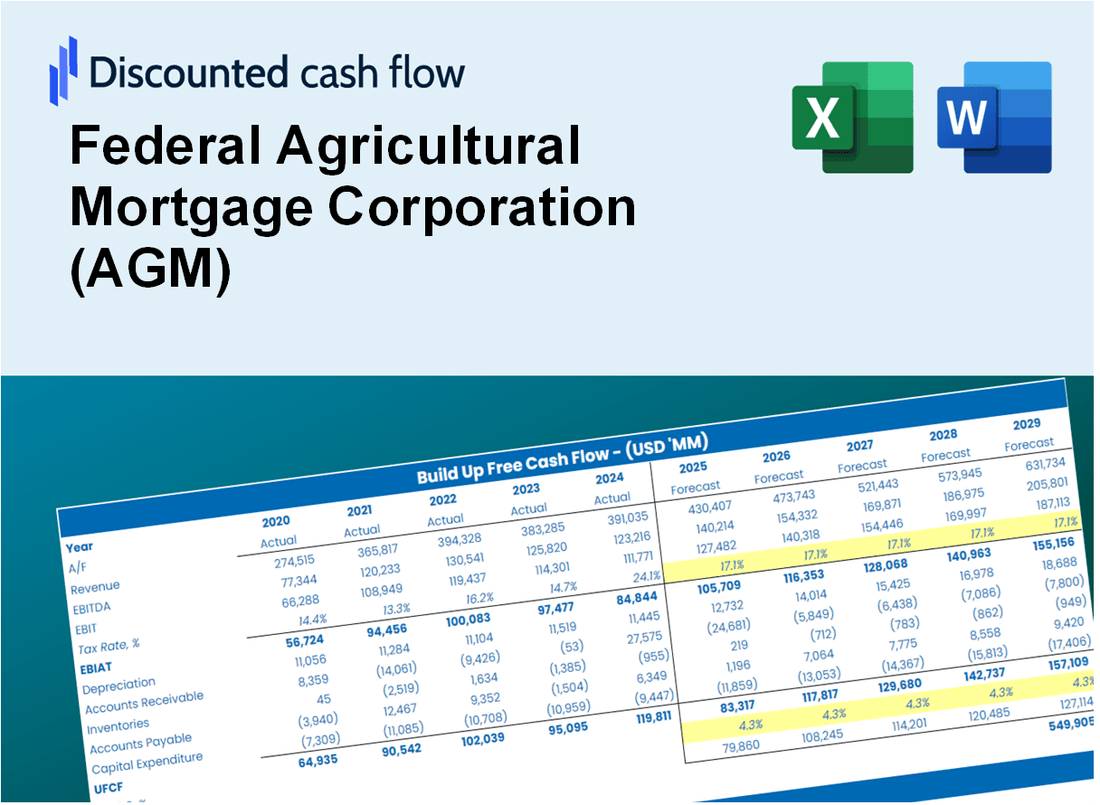
- Actual Data Insights: Historical performance data and forward-looking projections (highlighted in the yellow cells).
- Flexible Forecasting: Adjust forecast parameters such as revenue growth, EBITDA %, and WACC.
- Instant Calculations: Quickly observe how your inputs affect the valuation of Federal Agricultural Mortgage Corporation (AGM).
- Professional Resource: Designed for investors, CFOs, consultants, and financial analysts.
- Intuitive Layout: Organized for simplicity and user-friendliness, complete with step-by-step guidance.
Key Features
- Accurate Financial Data: Gain access to reliable historical records and future forecasts for Federal Agricultural Mortgage Corporation (AGM).
- Customizable Assumptions: Modify highlighted cells for key metrics such as WACC, growth rates, and profit margins.
- Real-Time Calculations: Automatic adjustments for DCF, Net Present Value (NPV), and cash flow metrics.
- Interactive Dashboard: User-friendly charts and summaries to help visualize your valuation insights.
- Designed for All Users: An intuitive layout suitable for investors, CFOs, and consultants alike.
How It Works
- Download: Obtain the comprehensive Excel file featuring Federal Agricultural Mortgage Corporation’s (AGM) financial data.
- Customize: Tailor your projections, including loan growth, net income %, and cost of capital.
- Update Automatically: The intrinsic value and NPV calculations refresh in real-time.
- Test Scenarios: Generate various forecasts and instantly compare results.
- Make Decisions: Utilize the valuation findings to inform your investment approach.
Why Choose Federal Agricultural Mortgage Corporation (AGM)?
- Support Agriculture: Invest in a company dedicated to enhancing the agricultural sector.
- Stable Returns: Benefit from a solid track record of consistent financial performance.
- Expertise in the Field: Leverage deep industry knowledge and experienced management.
- Commitment to Community: Engage in initiatives that support rural development and farmers.
- Trusted by Investors: Recognized for transparency and reliability in financial practices.
Who Should Use This Product?
- Investors: Evaluate Federal Agricultural Mortgage Corporation’s (AGM) performance before making investment decisions.
- CFOs and Financial Analysts: Enhance valuation methodologies and assess financial forecasts.
- Farm Operators and Agribusiness Owners: Understand how agricultural finance companies like Federal Agricultural Mortgage Corporation (AGM) are valued.
- Consultants: Provide detailed valuation analyses for agricultural clients.
- Students and Educators: Utilize industry-specific data to learn and teach valuation principles.
What the Template Contains
- Preloaded AGM Data: Historical and projected financial data, including revenue, EBIT, and capital expenditures.
- DCF and WACC Models: Professional-grade sheets for calculating intrinsic value and Weighted Average Cost of Capital.
- Editable Inputs: Yellow-highlighted cells for adjusting revenue growth, tax rates, and discount rates.
- Financial Statements: Comprehensive annual and quarterly financials for deeper analysis.
- Key Ratios: Profitability, leverage, and efficiency ratios to evaluate performance.
- Dashboard and Charts: Visual summaries of valuation outcomes and assumptions.
Disclaimer
All information, articles, and product details provided on this website are for general informational and educational purposes only. We do not claim any ownership over, nor do we intend to infringe upon, any trademarks, copyrights, logos, brand names, or other intellectual property mentioned or depicted on this site. Such intellectual property remains the property of its respective owners, and any references here are made solely for identification or informational purposes, without implying any affiliation, endorsement, or partnership.
We make no representations or warranties, express or implied, regarding the accuracy, completeness, or suitability of any content or products presented. Nothing on this website should be construed as legal, tax, investment, financial, medical, or other professional advice. In addition, no part of this site—including articles or product references—constitutes a solicitation, recommendation, endorsement, advertisement, or offer to buy or sell any securities, franchises, or other financial instruments, particularly in jurisdictions where such activity would be unlawful.
All content is of a general nature and may not address the specific circumstances of any individual or entity. It is not a substitute for professional advice or services. Any actions you take based on the information provided here are strictly at your own risk. You accept full responsibility for any decisions or outcomes arising from your use of this website and agree to release us from any liability in connection with your use of, or reliance upon, the content or products found herein.