
|
Airbus SE (Air.PA) Avaliação DCF |
Totalmente Editável: Adapte-Se Às Suas Necessidades No Excel Ou Planilhas
Design Profissional: Modelos Confiáveis E Padrão Da Indústria
Pré-Construídos Para Uso Rápido E Eficiente
Compatível com MAC/PC, totalmente desbloqueado
Não É Necessária Experiência; Fácil De Seguir
Airbus SE (AIR.PA) Bundle
Seja você um investidor ou analista, a calculadora DCF da Airbus SE (Airpa) é o seu recurso final para uma avaliação precisa. Pré-carregado com dados reais da Airbus, você pode ajustar facilmente as previsões e visualizar os efeitos em tempo real.
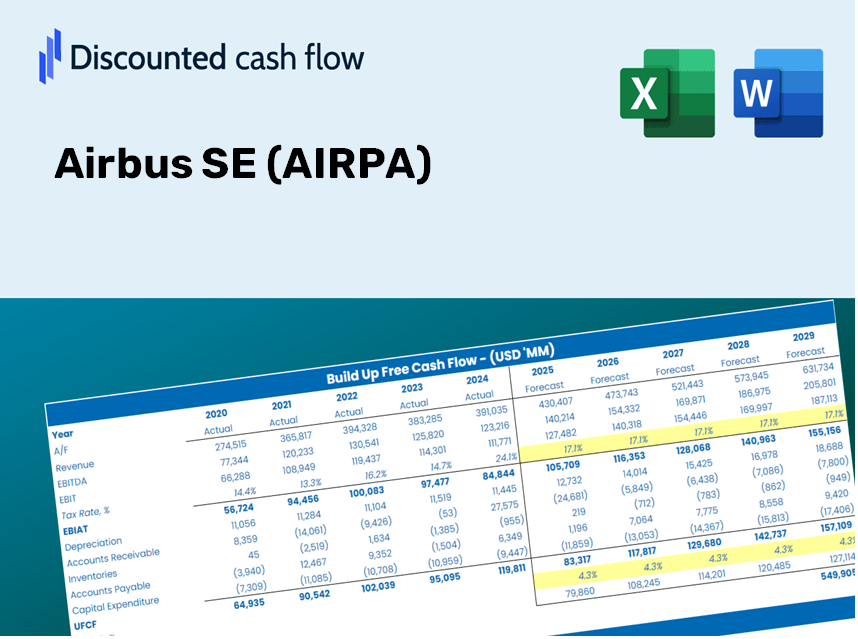
Discounted Cash Flow (DCF) - (USD MM)
| Year | AY1 2020 |
AY2 2021 |
AY3 2022 |
AY4 2023 |
AY5 2024 |
FY1 2025 |
FY2 2026 |
FY3 2027 |
FY4 2028 |
FY5 2029 |
|---|---|---|---|---|---|---|---|---|---|---|
| Revenue | 49,912.0 | 52,149.0 | 58,763.0 | 65,446.0 | 69,230.0 | 75,169.8 | 81,619.3 | 88,622.1 | 96,225.8 | 104,481.8 |
| Revenue Growth, % | 0 | 4.48 | 12.68 | 11.37 | 5.78 | 8.58 | 8.58 | 8.58 | 8.58 | 8.58 |
| EBITDA | 2,112.0 | 7,686.0 | 8,203.0 | 7,764.0 | 9,178.0 | 8,727.2 | 9,476.0 | 10,289.0 | 11,171.8 | 12,130.3 |
| EBITDA, % | 4.23 | 14.74 | 13.96 | 11.86 | 13.26 | 11.61 | 11.61 | 11.61 | 11.61 | 11.61 |
| Depreciation | 2,831.0 | 2,325.0 | 2,716.0 | 2,242.0 | 2,853.0 | 3,352.4 | 3,640.1 | 3,952.4 | 4,291.5 | 4,659.7 |
| Depreciation, % | 5.67 | 4.46 | 4.62 | 3.43 | 4.12 | 4.46 | 4.46 | 4.46 | 4.46 | 4.46 |
| EBIT | -719.0 | 5,361.0 | 5,487.0 | 5,522.0 | 6,325.0 | 5,374.8 | 5,835.9 | 6,336.6 | 6,880.3 | 7,470.6 |
| EBIT, % | -1.44 | 10.28 | 9.34 | 8.44 | 9.14 | 7.15 | 7.15 | 7.15 | 7.15 | 7.15 |
| Total Cash | 16,358.0 | 16,196.0 | 18,547.0 | 18,834.0 | 19,179.0 | 22,832.8 | 24,791.8 | 26,918.9 | 29,228.5 | 31,736.2 |
| Total Cash, percent | .0 | .0 | .0 | .0 | .0 | .0 | .0 | .0 | .0 | .0 |
| Account Receivables | 7,832.0 | 7,674.0 | 7,558.0 | 7,800.0 | 7,926.0 | 10,018.0 | 10,877.6 | 11,810.8 | 12,824.2 | 13,924.5 |
| Account Receivables, % | 15.69 | 14.72 | 12.86 | 11.92 | 11.45 | 13.33 | 13.33 | 13.33 | 13.33 | 13.33 |
| Inventories | 27,286.0 | 25,166.0 | 27,157.0 | 27,740.0 | 31,046.0 | 35,536.0 | 38,584.9 | 41,895.5 | 45,490.0 | 49,393.0 |
| Inventories, % | 54.67 | 48.26 | 46.21 | 42.39 | 44.84 | 47.27 | 47.27 | 47.27 | 47.27 | 47.27 |
| Accounts Payable | 8,722.0 | 9,693.0 | 13,261.0 | 14,323.0 | 13,791.0 | 15,099.3 | 16,394.8 | 17,801.5 | 19,328.8 | 20,987.2 |
| Accounts Payable, % | 17.47 | 18.59 | 22.57 | 21.89 | 19.92 | 20.09 | 20.09 | 20.09 | 20.09 | 20.09 |
| Capital Expenditure | -1,759.0 | -1,928.0 | -2,464.0 | -3,051.0 | -3,669.0 | -3,213.7 | -3,489.4 | -3,788.8 | -4,113.8 | -4,466.8 |
| Capital Expenditure, % | -3.52 | -3.7 | -4.19 | -4.66 | -5.3 | -4.28 | -4.28 | -4.28 | -4.28 | -4.28 |
| Tax Rate, % | 21.99 | 21.99 | 21.99 | 21.99 | 21.99 | 21.99 | 21.99 | 21.99 | 21.99 | 21.99 |
| EBITAT | -720.9 | 4,492.9 | 4,591.8 | 4,387.3 | 4,934.1 | 4,568.0 | 4,960.0 | 5,385.5 | 5,847.6 | 6,349.3 |
| Depreciation | ||||||||||
| Changes in Account Receivables | ||||||||||
| Changes in Inventories | ||||||||||
| Changes in Accounts Payable | ||||||||||
| Capital Expenditure | ||||||||||
| UFCF | -26,044.9 | 8,138.9 | 6,536.8 | 3,815.3 | 154.1 | -566.9 | 2,497.7 | 2,712.0 | 2,944.7 | 3,197.3 |
| WACC, % | 8.15 | 8.07 | 8.07 | 8.05 | 8.04 | 8.07 | 8.07 | 8.07 | 8.07 | 8.07 |
| PV UFCF | ||||||||||
| SUM PV UFCF | 8,089.2 | |||||||||
| Long Term Growth Rate, % | 3.00 | |||||||||
| Free cash flow (T + 1) | 3,293 | |||||||||
| Terminal Value | 64,897 | |||||||||
| Present Terminal Value | 44,016 | |||||||||
| Enterprise Value | 52,105 | |||||||||
| Net Debt | -3,728 | |||||||||
| Equity Value | 55,833 | |||||||||
| Diluted Shares Outstanding, MM | 791 | |||||||||
| Equity Value Per Share | 70.59 |
Benefits You Will Receive
- Adjustable Forecast Inputs: Easily modify key assumptions (growth %, margins, WACC) to create various scenarios.
- Real-World Data: Airbus SE’s financial information pre-filled to facilitate your analysis.
- Automated DCF Outputs: The template computes Net Present Value (NPV) and intrinsic value automatically.
- Customizable and Professional Design: A sleek Excel model tailored to meet your valuation requirements.
- Designed for Analysts and Investors: Perfect for testing projections, validating strategies, and enhancing efficiency.
Key Features
- Comprehensive Financial Data: Access Airbus SE's historical financial reports and pre-populated projections.
- Customizable Parameters: Adjust inputs for WACC, tax rates, growth in revenue, and EBITDA margins.
- Real-Time Calculations: Witness instant recalibrations of Airbus SE's intrinsic value.
- Insightful Visual Representations: Clear dashboard charts showcase valuation results and essential metrics.
- Designed for Precision: A reliable tool tailored for analysts, investors, and finance professionals.
How It Works
- Step 1: Download the Excel file.
- Step 2: Examine the pre-filled Airbus data (historical and projected).
- Step 3: Modify key assumptions (yellow cells) according to your analysis.
- Step 4: Observe automatic recalculations for Airbus’s intrinsic value.
- Step 5: Utilize the results for investment decisions or reporting.
Why Opt for This Calculator?
- User-Friendly Interface: Crafted for both novices and seasoned users.
- Customizable Inputs: Effortlessly adjust assumptions to suit your analysis.
- Real-Time Updates: Observe immediate changes to Airbus's valuation as you modify inputs.
- Pre-Configured: Comes loaded with Airbus’s actual financial data for swift evaluation.
- Preferred by Experts: Employed by investors and analysts for making well-informed choices.
Who Can Benefit from This Product?
- Professional Investors: Develop comprehensive and trustworthy valuation models for evaluating portfolios.
- Corporate Finance Teams: Assess valuation scenarios to inform strategic decisions within the organization.
- Consultants and Advisors: Deliver precise valuation insights to clients regarding Airbus SE (AIRPA) stock.
- Students and Educators: Utilize real-world data to enhance the practice and teaching of financial modeling.
- Aerospace Enthusiasts: Gain insights into the valuation processes of companies like Airbus SE (AIRPA) in the marketplace.
Contents of the Template
- Operating and Balance Sheet Data: Pre-filled historical data and forecasts for Airbus SE (AIRPA), including revenue, EBITDA, EBIT, and capital expenditures.
- WACC Calculation: A dedicated sheet for calculating the Weighted Average Cost of Capital (WACC), featuring parameters such as Beta, risk-free rate, and share price.
- DCF Valuation (Unlevered and Levered): Customizable Discounted Cash Flow models that detail intrinsic value with comprehensive calculations.
- Financial Statements: Pre-loaded annual and quarterly financial statements to facilitate analysis.
- Key Ratios: Comprehensive ratios for profitability, leverage, and efficiency relevant to Airbus SE (AIRPA).
- Dashboard and Charts: Visual representations of valuation outputs and assumptions for easy result analysis.
Disclaimer
All information, articles, and product details provided on this website are for general informational and educational purposes only. We do not claim any ownership over, nor do we intend to infringe upon, any trademarks, copyrights, logos, brand names, or other intellectual property mentioned or depicted on this site. Such intellectual property remains the property of its respective owners, and any references here are made solely for identification or informational purposes, without implying any affiliation, endorsement, or partnership.
We make no representations or warranties, express or implied, regarding the accuracy, completeness, or suitability of any content or products presented. Nothing on this website should be construed as legal, tax, investment, financial, medical, or other professional advice. In addition, no part of this site—including articles or product references—constitutes a solicitation, recommendation, endorsement, advertisement, or offer to buy or sell any securities, franchises, or other financial instruments, particularly in jurisdictions where such activity would be unlawful.
All content is of a general nature and may not address the specific circumstances of any individual or entity. It is not a substitute for professional advice or services. Any actions you take based on the information provided here are strictly at your own risk. You accept full responsibility for any decisions or outcomes arising from your use of this website and agree to release us from any liability in connection with your use of, or reliance upon, the content or products found herein.