
|
Digital Turbine, Inc. (APPS) Avaliação DCF |
Totalmente Editável: Adapte-Se Às Suas Necessidades No Excel Ou Planilhas
Design Profissional: Modelos Confiáveis E Padrão Da Indústria
Pré-Construídos Para Uso Rápido E Eficiente
Compatível com MAC/PC, totalmente desbloqueado
Não É Necessária Experiência; Fácil De Seguir
Digital Turbine, Inc. (APPS) Bundle
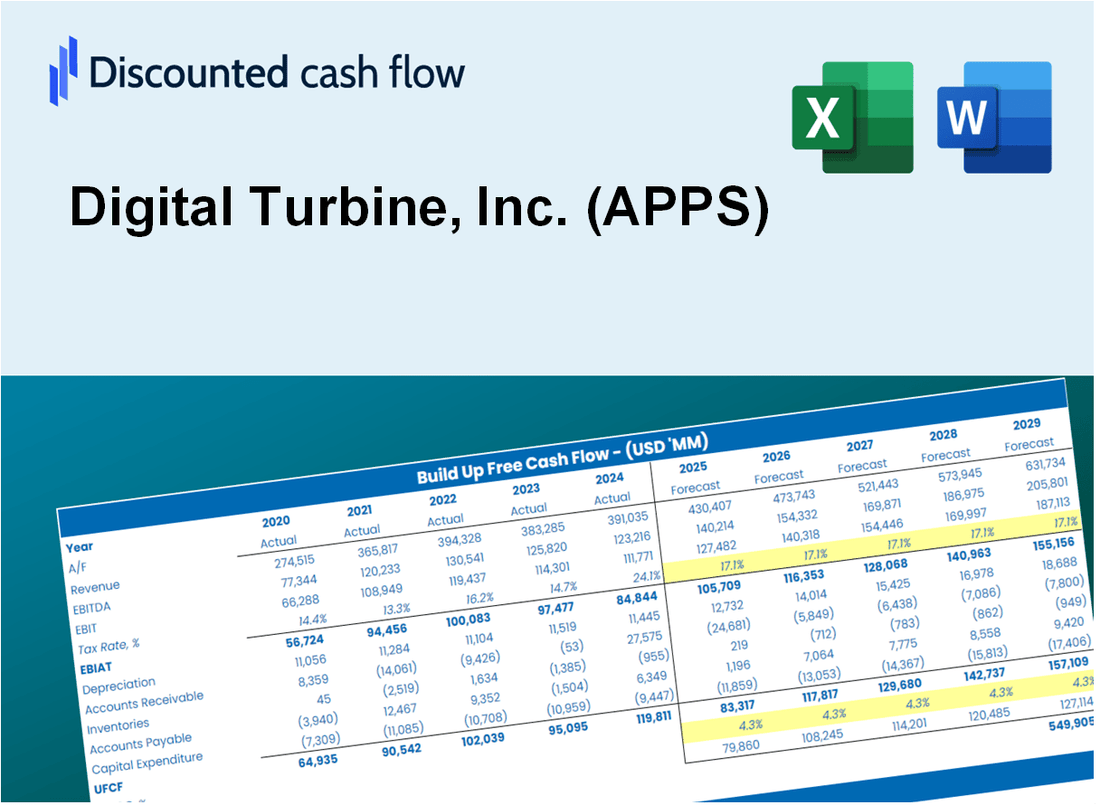
Avaliação Digital Turbine, Inc. (APPS) Streamline com esta calculadora DCF personalizável! Equipado com autênticas Finanças Digital Turbine, Inc. (APPS) e insumos de previsão ajustáveis, você pode explorar vários cenários e determinar o valor justo da Digital Turbine, Inc. (APPS) em apenas alguns minutos.
Discounted Cash Flow (DCF) - (USD MM)
| Year | AY1 2021 |
AY2 2022 |
AY3 2023 |
AY4 2024 |
AY5 2025 |
FY1 2026 |
FY2 2027 |
FY3 2028 |
FY4 2029 |
FY5 2030 |
|---|---|---|---|---|---|---|---|---|---|---|
| Revenue | 747.6 | 665.9 | 544.5 | 490.5 | 490.5 | 521.6 | 554.7 | 589.9 | 627.3 | 667.0 |
| Revenue Growth, % | 0 | -10.93 | -18.24 | -9.91 | 0 | 6.34 | 6.34 | 6.34 | 6.34 | 6.34 |
| EBITDA | 149.7 | 127.2 | 46.1 | 28.8 | 28.8 | 61.9 | 65.8 | 70.0 | 74.5 | 79.2 |
| EBITDA, % | 20.02 | 19.11 | 8.46 | 5.88 | 5.88 | 11.87 | 11.87 | 11.87 | 11.87 | 11.87 |
| Depreciation | 57.5 | 81.1 | 83.9 | 82.9 | 82.9 | 72.1 | 76.6 | 81.5 | 86.6 | 92.1 |
| Depreciation, % | 7.68 | 12.17 | 15.4 | 16.9 | 16.9 | 13.81 | 13.81 | 13.81 | 13.81 | 13.81 |
| EBIT | 92.2 | 46.2 | -37.8 | -54.1 | -54.1 | -10.1 | -10.8 | -11.5 | -12.2 | -13.0 |
| EBIT, % | 12.34 | 6.93 | -6.94 | -11.02 | -11.02 | -1.94 | -1.94 | -1.94 | -1.94 | -1.94 |
| Total Cash | 31.1 | 127.2 | 75.6 | 33.6 | 40.1 | 54.4 | 57.9 | 61.5 | 65.4 | 69.6 |
| Total Cash, percent | .0 | .0 | .0 | .0 | .0 | .0 | .0 | .0 | .0 | .0 |
| Account Receivables | 62.0 | 263.1 | 178.2 | 191.0 | 190.1 | 165.1 | 175.5 | 186.7 | 198.5 | 211.1 |
| Account Receivables, % | 8.29 | 39.52 | 32.73 | 38.94 | 38.75 | 31.64 | 31.64 | 31.64 | 31.64 | 31.64 |
| Inventories | .0 | .0 | .0 | .0 | .0 | .0 | .0 | .0 | .0 | .0 |
| Inventories, % | 0 | 0 | 0 | 0 | 0 | 0 | 0 | 0 | 0 | 0 |
| Accounts Payable | 35.0 | 167.9 | 119.3 | 159.2 | 139.9 | 117.7 | 125.1 | 133.1 | 141.5 | 150.5 |
| Accounts Payable, % | 4.68 | 25.21 | 21.92 | 32.46 | 28.53 | 22.56 | 22.56 | 22.56 | 22.56 | 22.56 |
| Capital Expenditure | -9.2 | -23.9 | -24.3 | -27.5 | -27.5 | -21.4 | -22.7 | -24.2 | -25.7 | -27.3 |
| Capital Expenditure, % | -1.23 | -3.58 | -4.46 | -5.6 | -5.6 | -4.1 | -4.1 | -4.1 | -4.1 | -4.1 |
| Tax Rate, % | -4.82 | -4.82 | -4.82 | -4.82 | -4.82 | -4.82 | -4.82 | -4.82 | -4.82 | -4.82 |
| EBITAT | 74.6 | 35.0 | -39.2 | -56.7 | -56.7 | -9.3 | -9.8 | -10.5 | -11.1 | -11.8 |
| Depreciation | ||||||||||
| Changes in Account Receivables | ||||||||||
| Changes in Inventories | ||||||||||
| Changes in Accounts Payable | ||||||||||
| Capital Expenditure | ||||||||||
| UFCF | 95.8 | 23.9 | 56.8 | 25.8 | -19.6 | 44.1 | 41.1 | 43.7 | 46.4 | 49.4 |
| WACC, % | 11.08 | 10.89 | 11.79 | 11.79 | 11.79 | 11.46 | 11.46 | 11.46 | 11.46 | 11.46 |
| PV UFCF | ||||||||||
| SUM PV UFCF | 162.9 | |||||||||
| Long Term Growth Rate, % | 4.00 | |||||||||
| Free cash flow (T + 1) | 51 | |||||||||
| Terminal Value | 688 | |||||||||
| Present Terminal Value | 400 | |||||||||
| Enterprise Value | 563 | |||||||||
| Net Debt | 378 | |||||||||
| Equity Value | 185 | |||||||||
| Diluted Shares Outstanding, MM | 104 | |||||||||
| Equity Value Per Share | 1.78 |
What You Will Get
- Real APPS Financial Data: Pre-filled with Digital Turbine’s historical and projected data for precise analysis.
- Fully Editable Template: Modify key inputs like revenue growth, WACC, and EBITDA % with ease.
- Automatic Calculations: See Digital Turbine’s intrinsic value update instantly based on your changes.
- Professional Valuation Tool: Designed for investors, analysts, and consultants seeking accurate DCF results.
- User-Friendly Design: Simple structure and clear instructions for all experience levels.
Key Features
- 🔍 Real-Life APPS Financials: Pre-filled historical and projected data for Digital Turbine, Inc.
- ✏️ Fully Customizable Inputs: Adjust all critical parameters (yellow cells) like WACC, growth %, and tax rates.
- 📊 Professional DCF Valuation: Built-in formulas calculate Digital Turbine’s intrinsic value using the Discounted Cash Flow method.
- ⚡ Instant Results: Visualize Digital Turbine’s valuation instantly after making changes.
- Scenario Analysis: Test and compare outcomes for various financial assumptions side-by-side.
How It Works
- Step 1: Download the Excel file.
- Step 2: Review pre-entered Digital Turbine, Inc. (APPS) data (historical and projected).
- Step 3: Adjust key assumptions (yellow cells) based on your analysis.
- Step 4: View automatic recalculations for Digital Turbine, Inc. (APPS)’s intrinsic value.
- Step 5: Use the outputs for investment decisions or reporting.
Why Choose This Calculator?
- Designed for Experts: A sophisticated tool tailored for analysts, CFOs, and consultants.
- Accurate Data: Digital Turbine’s historical and projected financials preloaded for precision.
- Versatile Scenario Testing: Effortlessly simulate various forecasts and assumptions.
- Comprehensive Outputs: Automatically computes intrinsic value, NPV, and essential metrics.
- User-Friendly: Step-by-step guidance ensures a smooth experience.
Who Should Use This Product?
- App Developers: Discover monetization strategies and analyze user engagement metrics.
- Marketing Professionals: Integrate advanced analytics into campaigns for better targeting and performance.
- Investors: Evaluate your investment strategies and assess the market potential of Digital Turbine, Inc. (APPS).
- Data Analysts: Enhance your analysis with customizable dashboards and reporting tools.
- Entrepreneurs: Learn from the growth strategies of successful tech companies like Digital Turbine, Inc. (APPS).
What the Template Contains
- Preloaded APPS Data: Historical and projected financial data, including revenue, EBIT, and capital expenditures.
- DCF and WACC Models: Professional-grade sheets for calculating intrinsic value and Weighted Average Cost of Capital.
- Editable Inputs: Yellow-highlighted cells for adjusting revenue growth, tax rates, and discount rates.
- Financial Statements: Comprehensive annual and quarterly financials for deeper analysis.
- Key Ratios: Profitability, leverage, and efficiency ratios to evaluate performance.
- Dashboard and Charts: Visual summaries of valuation outcomes and assumptions.
Disclaimer
All information, articles, and product details provided on this website are for general informational and educational purposes only. We do not claim any ownership over, nor do we intend to infringe upon, any trademarks, copyrights, logos, brand names, or other intellectual property mentioned or depicted on this site. Such intellectual property remains the property of its respective owners, and any references here are made solely for identification or informational purposes, without implying any affiliation, endorsement, or partnership.
We make no representations or warranties, express or implied, regarding the accuracy, completeness, or suitability of any content or products presented. Nothing on this website should be construed as legal, tax, investment, financial, medical, or other professional advice. In addition, no part of this site—including articles or product references—constitutes a solicitation, recommendation, endorsement, advertisement, or offer to buy or sell any securities, franchises, or other financial instruments, particularly in jurisdictions where such activity would be unlawful.
All content is of a general nature and may not address the specific circumstances of any individual or entity. It is not a substitute for professional advice or services. Any actions you take based on the information provided here are strictly at your own risk. You accept full responsibility for any decisions or outcomes arising from your use of this website and agree to release us from any liability in connection with your use of, or reliance upon, the content or products found herein.