
|
Aura Biosciences, Inc. (AURA) Avaliação DCF |
Totalmente Editável: Adapte-Se Às Suas Necessidades No Excel Ou Planilhas
Design Profissional: Modelos Confiáveis E Padrão Da Indústria
Pré-Construídos Para Uso Rápido E Eficiente
Compatível com MAC/PC, totalmente desbloqueado
Não É Necessária Experiência; Fácil De Seguir
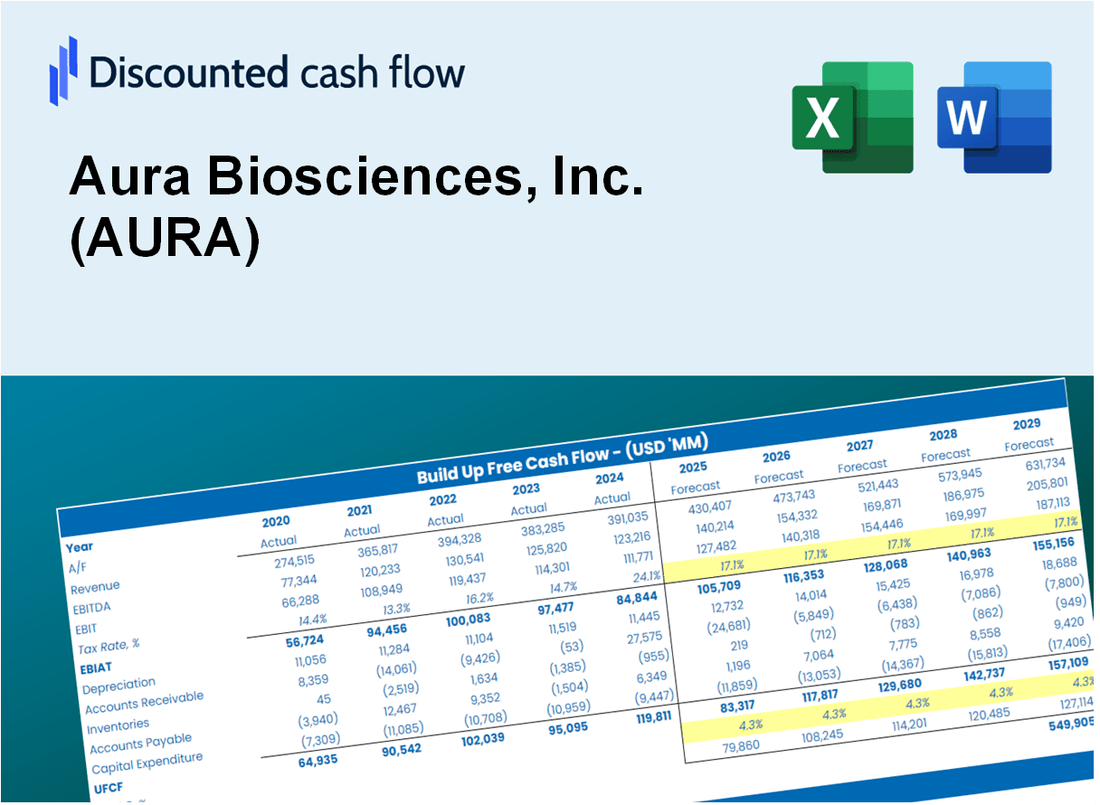
Aura Biosciences, Inc. (AURA) Bundle
Projetado para precisão, nossa calculadora DCF (AURA) permite avaliar a avaliação da Aura Biosciences, Inc. usando dados financeiros do mundo real, permitindo flexibilidade completa para modificar todos os parâmetros essenciais para melhorar as projeções.
Discounted Cash Flow (DCF) - (USD MM)
| Year | AY1 2020 |
AY2 2021 |
AY3 2022 |
AY4 2023 |
AY5 2024 |
FY1 2025 |
FY2 2026 |
FY3 2027 |
FY4 2028 |
FY5 2029 |
|---|---|---|---|---|---|---|---|---|---|---|
| Revenue | .0 | .0 | .0 | .0 | .0 | .0 | .0 | .0 | .0 | .0 |
| Revenue Growth, % | 0 | 0 | 0 | 0 | 0 | 0 | 0 | 0 | 0 | 0 |
| EBITDA | -21.4 | -34.4 | -59.1 | -83.7 | -85.6 | .0 | .0 | .0 | .0 | .0 |
| EBITDA, % | 100 | 100 | 100 | 100 | 100 | 100 | 100 | 100 | 100 | 100 |
| Depreciation | .8 | .8 | 1.2 | 1.3 | 1.2 | .0 | .0 | .0 | .0 | .0 |
| Depreciation, % | 100 | 100 | 100 | 100 | 100 | 100 | 100 | 100 | 100 | 100 |
| EBIT | -22.2 | -35.3 | -60.3 | -85.0 | -86.8 | .0 | .0 | .0 | .0 | .0 |
| EBIT, % | 100 | 100 | 100 | 100 | 100 | 100 | 100 | 100 | 100 | 100 |
| Total Cash | 17.4 | 149.1 | 188.8 | 226.2 | 151.1 | .0 | .0 | .0 | .0 | .0 |
| Total Cash, percent | .0 | .0 | .0 | .0 | .0 | .0 | .0 | .0 | .0 | .0 |
| Account Receivables | .0 | .0 | .0 | .0 | .0 | .0 | .0 | .0 | .0 | .0 |
| Account Receivables, % | 100 | 100 | 100 | 100 | 100 | 100 | 100 | 100 | 100 | 100 |
| Inventories | .0 | .0 | .0 | .0 | .0 | .0 | .0 | .0 | .0 | .0 |
| Inventories, % | 100 | 100 | 100 | 100 | 100 | 100 | 100 | 100 | 100 | 100 |
| Accounts Payable | .6 | 2.4 | 2.9 | 1.8 | 2.3 | .0 | .0 | .0 | .0 | .0 |
| Accounts Payable, % | 100 | 100 | 100 | 100 | 100 | 100 | 100 | 100 | 100 | 100 |
| Capital Expenditure | -.8 | -2.1 | -1.1 | -.7 | -1.3 | .0 | .0 | .0 | .0 | .0 |
| Capital Expenditure, % | 100 | 100 | 100 | 100 | 100 | 0 | 0 | 0 | 0 | 0 |
| Tax Rate, % | -0.12902 | -0.12902 | -0.12902 | -0.12902 | -0.12902 | -0.12902 | -0.12902 | -0.12902 | -0.12902 | -0.12902 |
| EBITAT | -22.2 | -35.3 | -60.3 | -85.1 | -86.9 | .0 | .0 | .0 | .0 | .0 |
| Depreciation | ||||||||||
| Changes in Account Receivables | ||||||||||
| Changes in Inventories | ||||||||||
| Changes in Accounts Payable | ||||||||||
| Capital Expenditure | ||||||||||
| UFCF | -21.5 | -34.8 | -59.7 | -85.7 | -86.4 | -2.3 | .0 | .0 | .0 | .0 |
| WACC, % | 5.71 | 5.71 | 5.71 | 5.71 | 5.71 | 5.71 | 5.71 | 5.71 | 5.71 | 5.71 |
| PV UFCF | ||||||||||
| SUM PV UFCF | -2.2 | |||||||||
| Long Term Growth Rate, % | 2.00 | |||||||||
| Free cash flow (T + 1) | 0 | |||||||||
| Terminal Value | 0 | |||||||||
| Present Terminal Value | 0 | |||||||||
| Enterprise Value | -2 | |||||||||
| Net Debt | -13 | |||||||||
| Equity Value | 11 | |||||||||
| Diluted Shares Outstanding, MM | 50 | |||||||||
| Equity Value Per Share | 0.22 |
What You Will Get
- Real AURA Financial Data: Pre-filled with Aura Biosciences’ historical and projected data for precise analysis.
- Fully Editable Template: Modify key inputs like revenue growth, WACC, and EBITDA % with ease.
- Automatic Calculations: See Aura Biosciences’ intrinsic value update instantly based on your changes.
- Professional Valuation Tool: Designed for investors, analysts, and consultants seeking accurate DCF results.
- User-Friendly Design: Simple structure and clear instructions for all experience levels.
Key Features
- Comprehensive Data: Aura Biosciences' historical financial statements and pre-filled projections.
- Customizable Inputs: Modify WACC, tax rates, revenue growth, and EBITDA margins to fit your analysis.
- Real-Time Insights: Observe Aura Biosciences' intrinsic value recalculating instantly.
- Intuitive Visualizations: Dashboard charts showcase valuation outcomes and essential metrics.
- Designed for Precision: A professional-grade tool tailored for analysts, investors, and finance professionals.
How It Works
- Step 1: Download the Excel file for Aura Biosciences, Inc. (AURA).
- Step 2: Review the pre-filled financial data and forecasts for Aura Biosciences.
- Step 3: Adjust key inputs such as revenue growth, WACC, and tax rates (highlighted cells).
- Step 4: Observe the DCF model update in real-time as you modify your assumptions.
- Step 5: Analyze the outputs and leverage the results for your investment decisions.
Why Choose This Calculator for Aura Biosciences, Inc. (AURA)?
- Accurate Data: Utilize real Aura Biosciences financials for dependable valuation outcomes.
- Customizable: Modify essential parameters such as growth rates, WACC, and tax rates to align with your forecasts.
- Time-Saving: Built-in calculations save you from starting from the ground up.
- Professional-Grade Tool: Tailored for investors, analysts, and consultants in the biotech sector.
- User-Friendly: Simple interface and guided instructions ensure accessibility for all users.
Who Should Use Aura Biosciences, Inc. (AURA)?
- Investors: Evaluate Aura's market potential before making investment decisions.
- CFOs and Financial Analysts: Optimize valuation methodologies and analyze financial forecasts.
- Startup Founders: Gain insights into how biotech companies like Aura are appraised.
- Consultants: Provide detailed valuation assessments for clients in the biotech sector.
- Students and Educators: Utilize current data to teach and practice valuation strategies in biotechnology.
What the Template Contains
- Comprehensive DCF Model: Editable template featuring detailed valuation calculations.
- Real-World Data: Aura Biosciences, Inc. (AURA)’s historical and projected financials preloaded for analysis.
- Customizable Parameters: Adjust WACC, growth rates, and tax assumptions to explore various scenarios.
- Financial Statements: Complete annual and quarterly breakdowns for enhanced insights.
- Key Ratios: Integrated analysis for profitability, efficiency, and leverage metrics.
- Dashboard with Visual Outputs: Charts and tables to provide clear, actionable results.
Disclaimer
All information, articles, and product details provided on this website are for general informational and educational purposes only. We do not claim any ownership over, nor do we intend to infringe upon, any trademarks, copyrights, logos, brand names, or other intellectual property mentioned or depicted on this site. Such intellectual property remains the property of its respective owners, and any references here are made solely for identification or informational purposes, without implying any affiliation, endorsement, or partnership.
We make no representations or warranties, express or implied, regarding the accuracy, completeness, or suitability of any content or products presented. Nothing on this website should be construed as legal, tax, investment, financial, medical, or other professional advice. In addition, no part of this site—including articles or product references—constitutes a solicitation, recommendation, endorsement, advertisement, or offer to buy or sell any securities, franchises, or other financial instruments, particularly in jurisdictions where such activity would be unlawful.
All content is of a general nature and may not address the specific circumstances of any individual or entity. It is not a substitute for professional advice or services. Any actions you take based on the information provided here are strictly at your own risk. You accept full responsibility for any decisions or outcomes arising from your use of this website and agree to release us from any liability in connection with your use of, or reliance upon, the content or products found herein.