
|
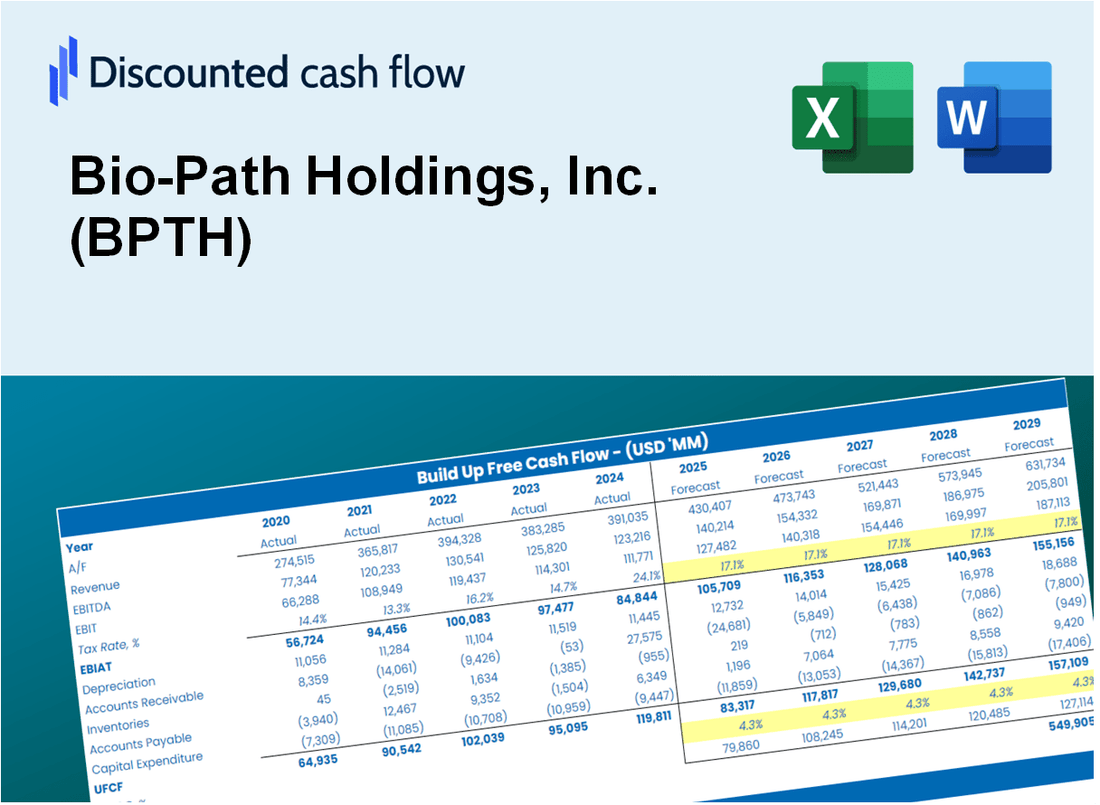
Avaliação DCF Bio-Path Holdings, Inc. (BPTH) |
Totalmente Editável: Adapte-Se Às Suas Necessidades No Excel Ou Planilhas
Design Profissional: Modelos Confiáveis E Padrão Da Indústria
Pré-Construídos Para Uso Rápido E Eficiente
Compatível com MAC/PC, totalmente desbloqueado
Não É Necessária Experiência; Fácil De Seguir
Bio-Path Holdings, Inc. (BPTH) Bundle
Obtenha informações sobre sua análise de avaliação Bio-Path Holdings, Inc. (BPTH) usando nossa sofisticada calculadora DCF! Pré-carregado com dados reais (BPTH), este modelo do Excel permite ajustar as previsões e suposições para determinar com precisão o valor intrínseco de Bio-Path Holdings, Inc.
What You Will Get
- Comprehensive BPTH Financials: Access to both historical and projected data for precise valuation.
- Customizable Parameters: Adjust WACC, tax rates, revenue growth, and capital expenditures to fit your analysis.
- Dynamic Calculations: Intrinsic value and NPV are computed in real-time.
- Scenario Testing: Explore various scenarios to assess Bio-Path Holdings’ future performance.
- User-Friendly Interface: Designed for industry professionals while being easy to navigate for newcomers.
Key Features
- 🔍 Real-Life BPTH Financials: Pre-filled historical and projected data for Bio-Path Holdings, Inc.
- ✏️ Fully Customizable Inputs: Adjust all critical parameters (yellow cells) like WACC, growth %, and tax rates.
- 📊 Professional DCF Valuation: Built-in formulas calculate Bio-Path's intrinsic value using the Discounted Cash Flow method.
- ⚡ Instant Results: Visualize Bio-Path's valuation instantly after making changes.
- Scenario Analysis: Test and compare outcomes for various financial assumptions side-by-side.
How It Works
- Step 1: Download the Excel file.
- Step 2: Review pre-entered Bio-Path Holdings data (historical and projected).
- Step 3: Adjust key assumptions (yellow cells) based on your analysis.
- Step 4: View automatic recalculations for Bio-Path Holdings’ intrinsic value.
- Step 5: Use the outputs for investment decisions or reporting.
Why Choose This Calculator for Bio-Path Holdings, Inc. (BPTH)?
- All-in-One Solution: Combines DCF, WACC, and financial ratio evaluations tailored for BPTH.
- Flexible Inputs: Modify the yellow-highlighted fields to explore different financial scenarios.
- In-Depth Analysis: Automatically computes Bio-Path's intrinsic value and Net Present Value.
- Preloaded Information: Access to historical and projected data for precise analysis.
- Expert-Level Tool: Perfect for financial analysts, investors, and business advisors focusing on BPTH.
Who Should Use This Product?
- Investors: Evaluate Bio-Path Holdings, Inc. (BPTH) for informed stock trading decisions.
- CFOs and Financial Analysts: Optimize valuation methodologies and assess future projections for BPTH.
- Startup Founders: Understand the valuation strategies of established biotech firms like Bio-Path Holdings, Inc. (BPTH).
- Consultants: Create detailed valuation reports to guide clients in the biotech sector.
- Students and Educators: Utilize real-time data from Bio-Path Holdings, Inc. (BPTH) to teach and learn valuation practices.
What the Template Contains
- Operating and Balance Sheet Data: Pre-filled Bio-Path Holdings, Inc. (BPTH) historical data and forecasts, including revenue, EBITDA, EBIT, and capital expenditures.
- WACC Calculation: A dedicated sheet for Weighted Average Cost of Capital (WACC), including parameters like Beta, risk-free rate, and share price.
- DCF Valuation (Unlevered and Levered): Editable Discounted Cash Flow models showing intrinsic value with detailed calculations.
- Financial Statements: Pre-loaded financial statements (annual and quarterly) to support analysis.
- Key Ratios: Includes profitability, leverage, and efficiency ratios for Bio-Path Holdings, Inc. (BPTH).
- Dashboard and Charts: Visual summary of valuation outputs and assumptions to analyze results easily.
Disclaimer
All information, articles, and product details provided on this website are for general informational and educational purposes only. We do not claim any ownership over, nor do we intend to infringe upon, any trademarks, copyrights, logos, brand names, or other intellectual property mentioned or depicted on this site. Such intellectual property remains the property of its respective owners, and any references here are made solely for identification or informational purposes, without implying any affiliation, endorsement, or partnership.
We make no representations or warranties, express or implied, regarding the accuracy, completeness, or suitability of any content or products presented. Nothing on this website should be construed as legal, tax, investment, financial, medical, or other professional advice. In addition, no part of this site—including articles or product references—constitutes a solicitation, recommendation, endorsement, advertisement, or offer to buy or sell any securities, franchises, or other financial instruments, particularly in jurisdictions where such activity would be unlawful.
All content is of a general nature and may not address the specific circumstances of any individual or entity. It is not a substitute for professional advice or services. Any actions you take based on the information provided here are strictly at your own risk. You accept full responsibility for any decisions or outcomes arising from your use of this website and agree to release us from any liability in connection with your use of, or reliance upon, the content or products found herein.