
|
Dutch Bros Inc. (Bros) DCF Avaliação |
Totalmente Editável: Adapte-Se Às Suas Necessidades No Excel Ou Planilhas
Design Profissional: Modelos Confiáveis E Padrão Da Indústria
Pré-Construídos Para Uso Rápido E Eficiente
Compatível com MAC/PC, totalmente desbloqueado
Não É Necessária Experiência; Fácil De Seguir
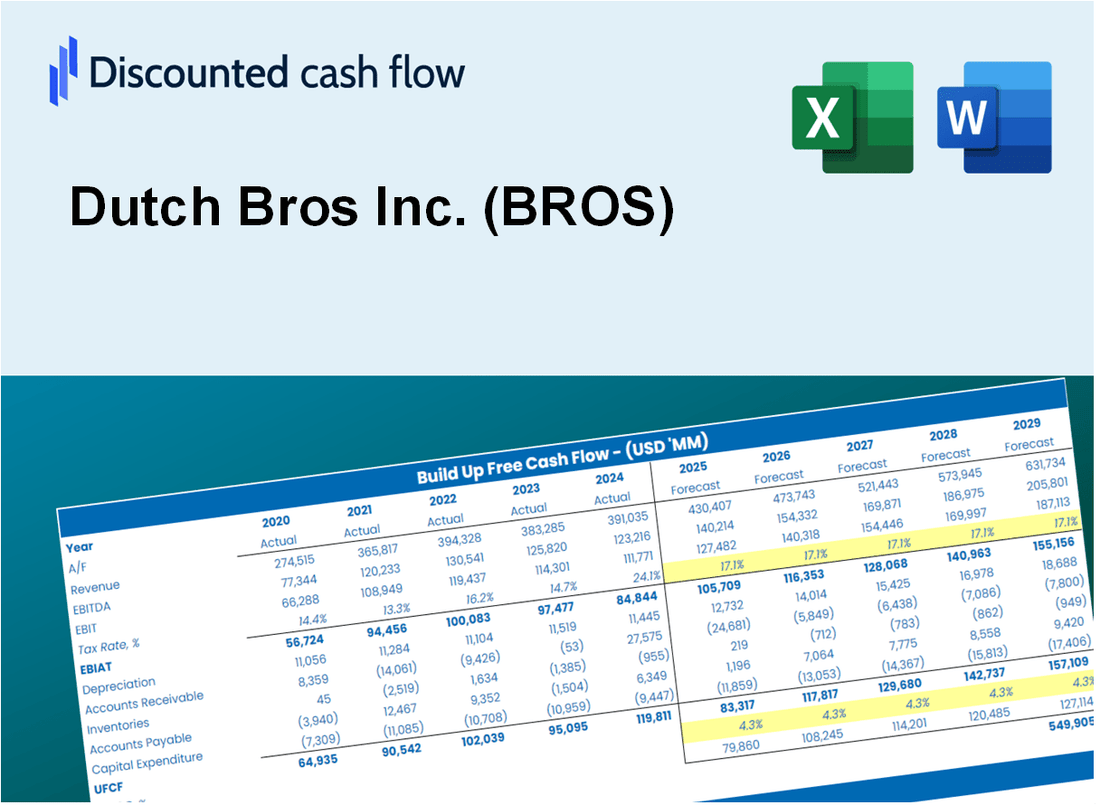
Dutch Bros Inc. (BROS) Bundle
Projetado para precisão, nossa calculadora DCF [BROS] capacita você a avaliar a avaliação Dutch Bros Inc. usando dados financeiros atualizados, fornecendo a flexibilidade completa para modificar todos os parâmetros-chave para uma previsão aprimorada.
Discounted Cash Flow (DCF) - (USD MM)
| Year | AY1 2020 |
AY2 2021 |
AY3 2022 |
AY4 2023 |
AY5 2024 |
FY1 2025 |
FY2 2026 |
FY3 2027 |
FY4 2028 |
FY5 2029 |
|---|---|---|---|---|---|---|---|---|---|---|
| Revenue | 327.4 | 497.9 | 739.0 | 965.8 | 1,281.0 | 1,805.7 | 2,545.2 | 3,587.6 | 5,056.9 | 7,128.0 |
| Revenue Growth, % | 0 | 52.06 | 48.43 | 30.68 | 32.64 | 40.96 | 40.96 | 40.96 | 40.96 | 40.96 |
| EBITDA | 26.2 | -87.2 | 46.1 | 118.4 | 204.9 | 90.1 | 127.1 | 179.1 | 252.4 | 355.8 |
| EBITDA, % | 7.99 | -17.52 | 6.24 | 12.26 | 16 | 4.99 | 4.99 | 4.99 | 4.99 | 4.99 |
| Depreciation | 15.5 | 25.2 | 44.7 | 69.1 | 93.0 | 109.4 | 154.1 | 217.3 | 306.3 | 431.7 |
| Depreciation, % | 4.75 | 5.06 | 6.05 | 7.16 | 7.26 | 6.06 | 6.06 | 6.06 | 6.06 | 6.06 |
| EBIT | 10.6 | -112.5 | 1.4 | 49.2 | 111.9 | -19.2 | -27.1 | -38.2 | -53.8 | -75.9 |
| EBIT, % | 3.25 | -22.59 | 0.18457 | 5.1 | 8.74 | -1.06 | -1.06 | -1.06 | -1.06 | -1.06 |
| Total Cash | 31.6 | 18.5 | 20.2 | 133.5 | 293.4 | 190.8 | 269.0 | 379.1 | 534.4 | 753.3 |
| Total Cash, percent | .0 | .0 | .0 | .0 | .0 | .0 | .0 | .0 | .0 | .0 |
| Account Receivables | 10.8 | 10.6 | 12.0 | 9.1 | 10.6 | 31.9 | 45.0 | 63.4 | 89.4 | 126.0 |
| Account Receivables, % | 3.31 | 2.14 | 1.62 | 0.94473 | 0.82731 | 1.77 | 1.77 | 1.77 | 1.77 | 1.77 |
| Inventories | 15.6 | 23.3 | 39.2 | 47.0 | 36.5 | 81.1 | 114.4 | 161.2 | 227.2 | 320.3 |
| Inventories, % | 4.76 | 4.69 | 5.31 | 4.86 | 2.85 | 4.49 | 4.49 | 4.49 | 4.49 | 4.49 |
| Accounts Payable | 16.1 | 20.4 | 21.3 | 30.0 | 32.2 | 63.3 | 89.2 | 125.7 | 177.2 | 249.7 |
| Accounts Payable, % | 4.91 | 4.11 | 2.88 | 3.1 | 2.52 | 3.5 | 3.5 | 3.5 | 3.5 | 3.5 |
| Capital Expenditure | -40.6 | -118.4 | -187.9 | -228.5 | -221.7 | -370.4 | -522.1 | -736.0 | -1,037.4 | -1,462.2 |
| Capital Expenditure, % | -12.39 | -23.79 | -25.42 | -23.66 | -17.31 | -20.51 | -20.51 | -20.51 | -20.51 | -20.51 |
| Tax Rate, % | 58.46 | 58.46 | 58.46 | 58.46 | 58.46 | 58.46 | 58.46 | 58.46 | 58.46 | 58.46 |
| EBITAT | 8.8 | -11.9 | .4 | 5.0 | 46.5 | -6.7 | -9.4 | -13.3 | -18.7 | -26.4 |
| Depreciation | ||||||||||
| Changes in Account Receivables | ||||||||||
| Changes in Inventories | ||||||||||
| Changes in Accounts Payable | ||||||||||
| Capital Expenditure | ||||||||||
| UFCF | -26.5 | -108.4 | -159.1 | -150.5 | -71.0 | -302.7 | -397.8 | -560.7 | -790.3 | -1,114.0 |
| WACC, % | 14.16 | 13.8 | 13.89 | 13.79 | 13.95 | 13.92 | 13.92 | 13.92 | 13.92 | 13.92 |
| PV UFCF | ||||||||||
| SUM PV UFCF | -2,001.6 | |||||||||
| Long Term Growth Rate, % | 4.00 | |||||||||
| Free cash flow (T + 1) | -1,159 | |||||||||
| Terminal Value | -11,683 | |||||||||
| Present Terminal Value | -6,090 | |||||||||
| Enterprise Value | -8,092 | |||||||||
| Net Debt | 650 | |||||||||
| Equity Value | -8,741 | |||||||||
| Diluted Shares Outstanding, MM | 115 | |||||||||
| Equity Value Per Share | -76.18 |
What You Will Receive
- Pre-Filled Financial Model: Dutch Bros Inc.'s actual data facilitates accurate DCF valuation.
- Comprehensive Forecast Control: Modify revenue growth, profit margins, WACC, and other essential drivers.
- Real-Time Calculations: Instant updates allow you to view results as you make adjustments.
- Professional-Grade Template: A polished Excel file crafted for high-quality valuation.
- Flexible and Reusable: Designed for adaptability, enabling continuous use for in-depth forecasts.
Key Features
- Pre-Loaded Data: Dutch Bros Inc.'s historical financial statements and pre-filled forecasts.
- Fully Adjustable Inputs: Modify WACC, tax rates, revenue growth, and EBITDA margins as needed.
- Instant Results: View Dutch Bros Inc.'s intrinsic value recalculating in real time.
- Clear Visual Outputs: Dashboard charts showcase valuation results and essential metrics.
- Built for Accuracy: A professional tool designed for analysts, investors, and finance professionals.
How It Works
- Step 1: Download the Excel file.
- Step 2: Review Dutch Bros Inc.'s (BROS) pre-filled financial data and forecasts.
- Step 3: Modify key inputs such as revenue growth, WACC, and tax rates (highlighted cells).
- Step 4: Observe the DCF model update in real-time as you adjust assumptions.
- Step 5: Analyze the outputs and utilize the results for investment decisions.
Why Choose This Calculator for Dutch Bros Inc. (BROS)?
- All-in-One Solution: Combines DCF, WACC, and financial ratio analyses tailored for Dutch Bros Inc.
- Flexible Parameters: Modify yellow-highlighted fields to explore different financial scenarios.
- In-Depth Analysis: Automatically computes Dutch Bros Inc.’s intrinsic value and Net Present Value.
- Integrated Data: Features historical and projected data for precise initial assessments.
- High-Quality Standards: Perfect for financial analysts, investors, and business advisors focusing on Dutch Bros Inc.
Who Should Use This Product?
- Investors: Accurately estimate Dutch Bros Inc.'s (BROS) fair value before making investment decisions.
- CFOs: Leverage a professional-grade DCF model for financial reporting and analysis specific to Dutch Bros Inc. (BROS).
- Consultants: Quickly adapt the template for valuation reports tailored to Dutch Bros Inc. (BROS) clients.
- Entrepreneurs: Gain insights into financial modeling practices used by leading companies like Dutch Bros Inc. (BROS).
- Educators: Use it as a teaching tool to demonstrate valuation methodologies applicable to Dutch Bros Inc. (BROS).
What the Template Contains
- Historical Data: Includes Dutch Bros Inc.'s (BROS) past financials and baseline forecasts.
- DCF and Levered DCF Models: Detailed templates to calculate Dutch Bros Inc.'s (BROS) intrinsic value.
- WACC Sheet: Pre-built calculations for Weighted Average Cost of Capital.
- Editable Inputs: Modify key drivers like growth rates, EBITDA %, and CAPEX assumptions.
- Quarterly and Annual Statements: A complete breakdown of Dutch Bros Inc.'s (BROS) financials.
- Interactive Dashboard: Visualize valuation results and projections dynamically.
Disclaimer
All information, articles, and product details provided on this website are for general informational and educational purposes only. We do not claim any ownership over, nor do we intend to infringe upon, any trademarks, copyrights, logos, brand names, or other intellectual property mentioned or depicted on this site. Such intellectual property remains the property of its respective owners, and any references here are made solely for identification or informational purposes, without implying any affiliation, endorsement, or partnership.
We make no representations or warranties, express or implied, regarding the accuracy, completeness, or suitability of any content or products presented. Nothing on this website should be construed as legal, tax, investment, financial, medical, or other professional advice. In addition, no part of this site—including articles or product references—constitutes a solicitation, recommendation, endorsement, advertisement, or offer to buy or sell any securities, franchises, or other financial instruments, particularly in jurisdictions where such activity would be unlawful.
All content is of a general nature and may not address the specific circumstances of any individual or entity. It is not a substitute for professional advice or services. Any actions you take based on the information provided here are strictly at your own risk. You accept full responsibility for any decisions or outcomes arising from your use of this website and agree to release us from any liability in connection with your use of, or reliance upon, the content or products found herein.