
|
Avaliação DCF da Cera Sanaryware Limited Limited (CERA.NS) |
Totalmente Editável: Adapte-Se Às Suas Necessidades No Excel Ou Planilhas
Design Profissional: Modelos Confiáveis E Padrão Da Indústria
Pré-Construídos Para Uso Rápido E Eficiente
Compatível com MAC/PC, totalmente desbloqueado
Não É Necessária Experiência; Fácil De Seguir
Cera Sanitaryware Limited (CERA.NS) Bundle
Aprimore suas opções de investimento com a calculadora (Cerans) DCF! Explore dados financeiros genuínos da Cera Sanitary Limited, ajuste as projeções e despesas de crescimento e observe instantaneamente como essas alterações afetam o valor intrínseco de (Cerans).
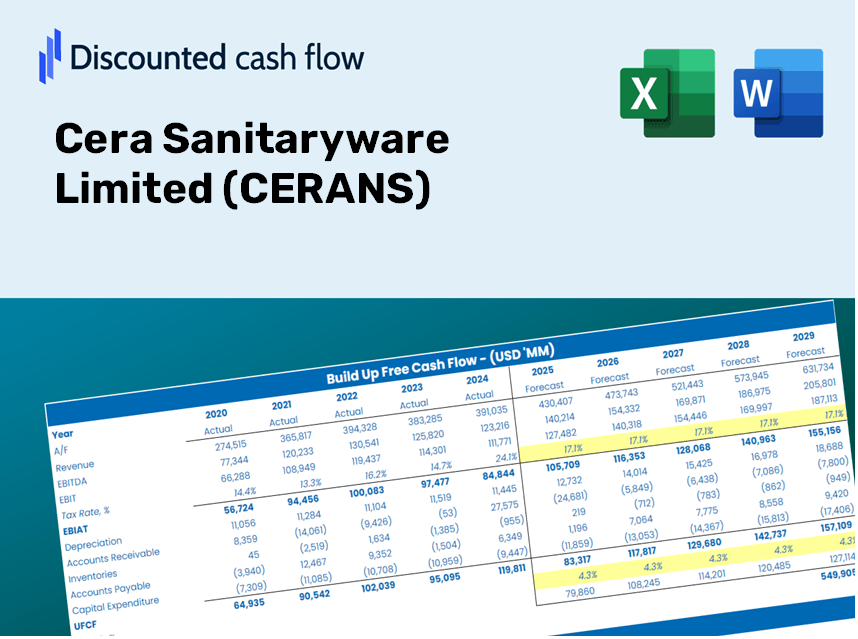
Discounted Cash Flow (DCF) - (USD MM)
| Year | AY1 2021 |
AY2 2022 |
AY3 2023 |
AY4 2024 |
AY5 2025 |
FY1 2026 |
FY2 2027 |
FY3 2028 |
FY4 2029 |
FY5 2030 |
|---|---|---|---|---|---|---|---|---|---|---|
| Revenue | 12,243.3 | 14,421.3 | 18,035.0 | 18,794.1 | 19,866.7 | 22,487.3 | 25,453.6 | 28,811.1 | 32,611.6 | 36,913.4 |
| Revenue Growth, % | 0 | 17.79 | 25.06 | 4.21 | 5.71 | 13.19 | 13.19 | 13.19 | 13.19 | 13.19 |
| EBITDA | 1,826.2 | 2,461.1 | 3,232.9 | 3,611.9 | 3,603.5 | 3,924.7 | 4,442.4 | 5,028.4 | 5,691.6 | 6,442.4 |
| EBITDA, % | 14.92 | 17.07 | 17.93 | 19.22 | 18.14 | 17.45 | 17.45 | 17.45 | 17.45 | 17.45 |
| Depreciation | 395.7 | 324.1 | 326.1 | 365.2 | 406.6 | 507.2 | 574.1 | 649.8 | 735.5 | 832.5 |
| Depreciation, % | 3.23 | 2.25 | 1.81 | 1.94 | 2.05 | 2.26 | 2.26 | 2.26 | 2.26 | 2.26 |
| EBIT | 1,430.5 | 2,137.0 | 2,906.8 | 3,246.7 | 3,197.0 | 3,417.5 | 3,868.3 | 4,378.6 | 4,956.1 | 5,609.9 |
| EBIT, % | 11.68 | 14.82 | 16.12 | 17.28 | 16.09 | 15.2 | 15.2 | 15.2 | 15.2 | 15.2 |
| Total Cash | 4,433.8 | 5,410.6 | 6,561.1 | 8,096.6 | 7,007.9 | 8,476.2 | 9,594.3 | 10,859.9 | 12,292.4 | 13,913.9 |
| Total Cash, percent | .0 | .0 | .0 | .0 | .0 | .0 | .0 | .0 | .0 | .0 |
| Account Receivables | 2,336.1 | 1,680.3 | 1,930.4 | 2,059.2 | 2,730.5 | 2,974.5 | 3,366.8 | 3,810.9 | 4,313.6 | 4,882.6 |
| Account Receivables, % | 19.08 | 11.65 | 10.7 | 10.96 | 13.74 | 13.23 | 13.23 | 13.23 | 13.23 | 13.23 |
| Inventories | 1,996.6 | 2,937.5 | 3,825.3 | 3,635.5 | 4,104.6 | 4,402.6 | 4,983.4 | 5,640.7 | 6,384.8 | 7,227.0 |
| Inventories, % | 16.31 | 20.37 | 21.21 | 19.34 | 20.66 | 19.58 | 19.58 | 19.58 | 19.58 | 19.58 |
| Accounts Payable | 1,553.6 | 2,093.7 | 2,069.3 | 1,789.7 | 1,879.1 | 2,593.4 | 2,935.4 | 3,322.7 | 3,760.9 | 4,257.1 |
| Accounts Payable, % | 12.69 | 14.52 | 11.47 | 9.52 | 9.46 | 11.53 | 11.53 | 11.53 | 11.53 | 11.53 |
| Capital Expenditure | -146.6 | -198.5 | -394.3 | -647.9 | -287.0 | -434.1 | -491.4 | -556.2 | -629.5 | -712.6 |
| Capital Expenditure, % | -1.2 | -1.38 | -2.19 | -3.45 | -1.44 | -1.93 | -1.93 | -1.93 | -1.93 | -1.93 |
| Tax Rate, % | 20.67 | 20.67 | 20.67 | 20.67 | 20.67 | 20.67 | 20.67 | 20.67 | 20.67 | 20.67 |
| EBITAT | 1,076.5 | 1,545.3 | 2,136.7 | 2,433.6 | 2,536.2 | 2,565.5 | 2,904.0 | 3,287.0 | 3,720.6 | 4,211.4 |
| Depreciation | ||||||||||
| Changes in Account Receivables | ||||||||||
| Changes in Inventories | ||||||||||
| Changes in Accounts Payable | ||||||||||
| Capital Expenditure | ||||||||||
| UFCF | -1,453.5 | 1,925.9 | 906.3 | 1,932.2 | 1,604.8 | 2,810.8 | 2,355.6 | 2,666.4 | 3,018.1 | 3,416.2 |
| WACC, % | 4.72 | 4.71 | 4.72 | 4.72 | 4.72 | 4.72 | 4.72 | 4.72 | 4.72 | 4.72 |
| PV UFCF | ||||||||||
| SUM PV UFCF | 12,377.2 | |||||||||
| Long Term Growth Rate, % | 4.00 | |||||||||
| Free cash flow (T + 1) | 3,553 | |||||||||
| Terminal Value | 495,095 | |||||||||
| Present Terminal Value | 393,179 | |||||||||
| Enterprise Value | 405,556 | |||||||||
| Net Debt | 357 | |||||||||
| Equity Value | 405,199 | |||||||||
| Diluted Shares Outstanding, MM | 13 | |||||||||
| Equity Value Per Share | 31,300.67 |
Benefits You Will Receive
- Adjustable Forecast Parameters: Effortlessly modify key assumptions (growth %, margins, WACC) to explore various scenarios.
- Comprehensive Market Data: Financial information for Cera Sanitaryware Limited (CERANS) pre-loaded to kickstart your analysis.
- Instant DCF Calculations: The template provides automatic calculations for Net Present Value (NPV) and intrinsic value.
- Tailorable and Professional Design: A sleek Excel model that customizes to fit your valuation requirements.
- Crafted for Analysts and Investors: Perfect for evaluating projections, confirming strategies, and enhancing efficiency.
Key Features
- Comprehensive Cera Data: Pre-populated with Cera Sanitaryware Limited’s historical financial performance and future projections.
- Customizable Input Options: Tailor revenue growth, profit margins, WACC, tax rates, and capital expenditure variables to fit your analysis.
- Interactive Valuation Framework: Instant updates to Net Present Value (NPV) and intrinsic value based on user-defined parameters.
- Scenario Analysis: Develop various forecasting scenarios to explore diverse valuation possibilities.
- Intuitive User Interface: Designed for ease of use, catering to both seasoned professionals and newcomers.
How It Functions
- Download the Template: Gain immediate access to the Excel-based CERANS DCF Calculator.
- Enter Your Assumptions: Modify the yellow-highlighted cells for growth rates, WACC, margins, and more.
- Automatic Calculations: The model will instantly update Cera Sanitaryware's intrinsic value.
- Explore Scenarios: Test various assumptions to assess potential valuation changes.
- Evaluate and Decide: Utilize the outcomes to inform your investment or financial analysis.
Why Opt for Cera Sanitaryware Limited (CERANS) Calculator?
- Precision: Accurate data derived from Cera’s financials ensures reliability.
- Versatility: Tailored for users to easily experiment with and adjust inputs.
- Efficiency: Eliminate the need to create a financial model from the ground up.
- High-Quality Standards: Crafted with the expertise of top financial professionals in mind.
- Intuitive Design: Simple to navigate, suitable for users without extensive financial modeling skills.
Who Can Benefit from Cera Sanitaryware Limited (CERANS)?
- Finance Students: Master valuation techniques using real-world data specific to Cera Sanitaryware Limited (CERANS).
- Academics: Integrate industry-standard models into your studies or research projects related to Cera Sanitaryware Limited (CERANS).
- Investors: Evaluate your hypotheses and assess valuation scenarios for Cera Sanitaryware Limited (CERANS).
- Analysts: Enhance your efficiency with a customizable, ready-made DCF model tailored for Cera Sanitaryware Limited (CERANS).
- Small Business Owners: Discover how major companies like Cera Sanitaryware Limited (CERANS) are evaluated in the market.
Contents of the Template
- Comprehensive DCF Model: An editable template featuring detailed valuation calculations.
- Real-World Data: Historical and projected financial data for Cera Sanitaryware Limited (CERANS) preloaded for your analysis.
- Customizable Parameters: Modify WACC, growth rates, and tax assumptions to explore various scenarios.
- Financial Statements: Complete annual and quarterly breakdowns for enhanced insights.
- Key Ratios: Integrated analysis of profitability, efficiency, and leverage metrics.
- Dashboard with Visual Outputs: Clear charts and tables providing actionable results.
Disclaimer
All information, articles, and product details provided on this website are for general informational and educational purposes only. We do not claim any ownership over, nor do we intend to infringe upon, any trademarks, copyrights, logos, brand names, or other intellectual property mentioned or depicted on this site. Such intellectual property remains the property of its respective owners, and any references here are made solely for identification or informational purposes, without implying any affiliation, endorsement, or partnership.
We make no representations or warranties, express or implied, regarding the accuracy, completeness, or suitability of any content or products presented. Nothing on this website should be construed as legal, tax, investment, financial, medical, or other professional advice. In addition, no part of this site—including articles or product references—constitutes a solicitation, recommendation, endorsement, advertisement, or offer to buy or sell any securities, franchises, or other financial instruments, particularly in jurisdictions where such activity would be unlawful.
All content is of a general nature and may not address the specific circumstances of any individual or entity. It is not a substitute for professional advice or services. Any actions you take based on the information provided here are strictly at your own risk. You accept full responsibility for any decisions or outcomes arising from your use of this website and agree to release us from any liability in connection with your use of, or reliance upon, the content or products found herein.