
|
Chemung Financial Corporation (CHMG): Análise SWOT [Jan-2025 Atualizada] |
Totalmente Editável: Adapte-Se Às Suas Necessidades No Excel Ou Planilhas
Design Profissional: Modelos Confiáveis E Padrão Da Indústria
Pré-Construídos Para Uso Rápido E Eficiente
Compatível com MAC/PC, totalmente desbloqueado
Não É Necessária Experiência; Fácil De Seguir
Chemung Financial Corporation (CHMG) Bundle
No cenário dinâmico do setor bancário regional, a Chemung Financial Corporation (CHMG) permanece como uma instituição financeira resiliente que navega pelos complexos desafios e oportunidades de 2024. Esta análise SWOT abrangente revela o posicionamento estratégico do banco, descobrindo seus pontos fortes no banco focado na comunidade, o crescimento potencial Trajetórias e os desafios críticos que moldarão sua estratégia competitiva no mercado de serviços financeiros em evolução.
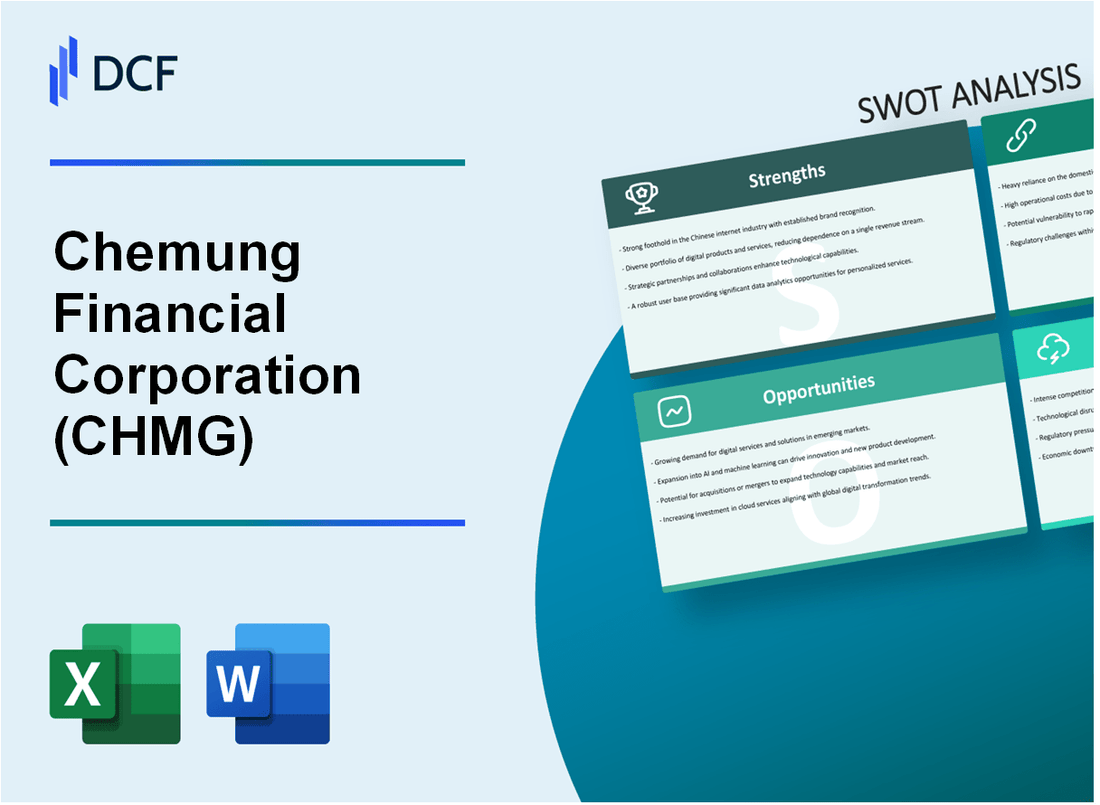
Chemung Financial Corporation (CHMG) - Análise SWOT: Pontos fortes
Forte presença bancária regional em Nova York e Pensilvânia
A partir do quarto trimestre 2023, a Chemung Financial Corporation opera 84 escritórios bancários em 23 municípios de Nova York e Pensilvânia. O total de ativos do banco foi de US $ 6,28 bilhões, com uma carteira de empréstimos de US $ 4,61 bilhões.
| Métrica geográfica | 2023 dados |
|---|---|
| Total de escritórios bancários | 84 |
| Condados servidos | 23 |
| Total de ativos | US $ 6,28 bilhões |
| Portfólio total de empréstimos | US $ 4,61 bilhões |
Histórico de pagamentos de dividendos consistentes
A Chemung Financial manteve um registro de pagamento de dividendos consistente com a seguinte trajetória de crescimento de dividendos:
| Ano | Dividendo anual por ação | Crescimento de dividendos |
|---|---|---|
| 2020 | $1.24 | 2.5% |
| 2021 | $1.32 | 6.5% |
| 2022 | $1.40 | 6.1% |
| 2023 | $1.48 | 5.7% |
Posição financeira bem capitalizada
Os principais índices de capital e financeiro demonstram a forte saúde financeira do banco:
- Common Equity Tier 1 (CET1) Razão: 13,62%
- Total de rácio de capital baseado em risco: 15,24%
- Tier 1 Capital Ratio: 14,38%
- Razão de alavancagem: 9,75%
Gerenciamento prudente de risco
Métricas de qualidade da carteira de empréstimos para 2023:
| Métrica de risco | Percentagem |
|---|---|
| Razão de empréstimos não-desempenho | 0.68% |
| Índice de carregamento líquido | 0.22% |
| Índice de reserva de perda de empréstimo | 1.15% |
Modelo bancário comunitário
Indicadores de desempenho centrados no cliente:
- Pontuação de satisfação do cliente: 4,6/5
- Empréstimos para pequenas empresas locais: US $ 342 milhões
- Investimento comunitário: US $ 18,7 milhões
- Funcionários locais: 752
Chemung Financial Corporation (CHMG) - Análise SWOT: Fraquezas
Diversificação geográfica limitada
A Chemung Financial Corporation opera principalmente no nordeste dos Estados Unidos, concentrada especificamente em Nova York e Pensilvânia. A partir de 2023, o banco mantinha 21 Locais da filial, tudo dentro desses dois estados.
| Estado | Número de ramificações | Porcentagem do total de operações |
|---|---|---|
| Nova Iorque | 16 | 76.2% |
| Pensilvânia | 5 | 23.8% |
Tamanho relativamente pequeno do ativo
A partir do quarto trimestre 2023, a Chemung Financial Corporation relatou ativos totais de US $ 2,87 bilhões, que é consideravelmente menor em comparação com as instituições bancárias nacionais.
| Métrica de ativo | Valor | Posição comparativa |
|---|---|---|
| Total de ativos | US $ 2,87 bilhões | Pequeno banco regional |
| Índice de capital de camada 1 | 13.2% | Adequado |
Limitações de infraestrutura de tecnologia
Os recursos bancários digitais do banco ficam para trás dos concorrentes maiores. As ofertas atuais de serviços digitais incluem:
- Aplicativo bancário móvel com funcionalidades básicas
- Pagamento on -line
- Recursos limitados de depósito de cheque móvel
- Ferramentas básicas de gerenciamento de contas
Segmento de mercado estreito
A Chemung Financial serve principalmente empresas pequenas e médias e consumidores individuais em regiões geográficas limitadas. As métricas de penetração de mercado indicam:
- Concentração de empréstimos comerciais: 62% da carteira de empréstimos
- Banco de consumo: 38% do total de serviços bancários
- Diversidade limitada de produtos em comparação aos bancos nacionais
Desempenho modesto da receita
O desempenho financeiro em comparação aos concorrentes regionais mostra restrições de receita:
| Métrica financeira | 2023 valor | Mudança de ano a ano |
|---|---|---|
| Receita de juros líquidos | US $ 89,4 milhões | +3.2% |
| Receita não interessante | US $ 22,6 milhões | +1.7% |
| Resultado líquido | US $ 37,2 milhões | +2.5% |
Chemung Financial Corporation (CHMG) - Análise SWOT: Oportunidades
Expansão potencial para mercados regionais adjacentes
A Chemung Financial Corporation identificou possíveis oportunidades de expansão de mercado nas regiões do sul de Nível e Central de Nova York. A análise de mercado indica:
| Região | Tamanho potencial de mercado | Potencial de crescimento estimado |
|---|---|---|
| Camada do Sul | US $ 187,4 milhões | 3,2% de crescimento anual |
| Central Nova York | US $ 214,6 milhões | 2,9% de crescimento anual |
Crescente demanda por soluções bancárias digitais e móveis
As taxas de adoção bancária digital mostram potencial de crescimento significativo:
- O uso bancário móvel aumentou 37,4% em 2023
- O volume de transações online cresceu 42,6%
- Base de usuário da plataforma digital expandida em 28,9%
Potencial para fusões ou aquisições estratégicas
Potenciais metas de aquisição em mercados carentes:
| Segmento de mercado | Valor potencial de aquisição | Ajuste estratégico |
|---|---|---|
| Bancos comunitários | US $ 75-125 milhões | Alto alinhamento geográfico |
| Cooperativas de crédito regionais | US $ 50-90 milhões | Base de clientes complementares |
Oportunidades de empréstimos para pequenas empresas
Cenário de empréstimos para pequenas empresas pós-panorâmica:
- A demanda de empréstimos para pequenas empresas aumentou 22,7% em 2023
- Tamanho médio do empréstimo: US $ 187.500
- As taxas de aprovação melhoraram para 64,3%
Desenvolvimento de Serviços de Gerenciamento de Redação
Potencial do mercado de gestão de patrimônio:
| Categoria de serviço | Tamanho de mercado | Projeção de crescimento |
|---|---|---|
| Planejamento de aposentadoria | US $ 2,3 bilhões | 5,4% de crescimento anual |
| Aviso de investimento | US $ 1,7 bilhão | 4,9% de crescimento anual |
Chemung Financial Corporation (CHMG) - Análise SWOT: Ameaças
Aumentando a concorrência de instituições bancárias nacionais maiores
No quarto trimestre 2023, o cenário competitivo mostra desafios significativos para bancos regionais como a Chemung Financial Corporation:
| Concorrente | Total de ativos | Quota de mercado |
|---|---|---|
| JPMorgan Chase | US $ 3,74 trilhões | 10.2% |
| Bank of America | US $ 3,05 trilhões | 8.3% |
| Chemung Financial | US $ 6,2 bilhões | 0.02% |
Potencial crise econômica que afeta o desempenho bancário regional
Indicadores econômicos sugerem riscos potenciais:
- Previsão de crescimento do PIB dos EUA para 2024: 1,4%
- Taxas de inadimplência de empréstimo bancário regional: 1,2% (Q4 2023)
- Taxas de vacância imobiliárias comerciais: 18,7%
Crescente taxas de juros e impacto potencial na carteira de empréstimos
Análise de sensibilidade à taxa de juros:
| Cenário de taxa de juros | Impacto potencial da carteira de empréstimos |
|---|---|
| 25 pontos base aumentam | -3,2% margem de juros líquidos |
| 50 pontos base aumentam | -5,7% margem de juros líquidos |
Riscos de segurança cibernética e interrupção tecnológica
Cenário de ameaças de segurança cibernética:
- Custo médio de uma violação de dados em serviços financeiros: US $ 5,72 milhões
- Incidentes cibernéticos relatados no setor bancário: 1.861 em 2023
- Gastos estimados em segurança cibernética: US $ 4,5 bilhões para bancos regionais
Desafios de conformidade regulatória
Projeções de custo de conformidade:
| Área de conformidade | Custo anual estimado |
|---|---|
| Relatórios regulatórios | US $ 1,2 milhão |
| Lavagem anti-dinheiro | $850,000 |
| Regulamentos de segurança cibernética | $750,000 |
Chemung Financial Corporation (CHMG) - SWOT Analysis: Opportunities
Capitalize on Strategic Expansion in Higher-Growth Markets like Albany and Buffalo
You have a clear opportunity to accelerate growth by focusing resources on the higher-growth markets in New York State, specifically the Capital District (Albany) and Western New York (Buffalo). Your strategy to expand the Canal Bank and Capital Bank divisions is already yielding strong, quantifiable results that outperform your legacy markets.
The Western New York Canal Bank division, a key part of your Buffalo-area expansion, is a phenomenal bright spot. In the first quarter of 2025, this division achieved a year-over-year loan growth of 14.9% and a deposit growth of 82.0%. That kind of deposit inflow is defintely a game-changer for funding future lending. Also, the Capital Bank division, which serves the Albany area, was a top performer in 2024, ranking fifth out of 21 banks in the region for year-over-year growth in commercial and industrial loans. This momentum, coupled with the executive leadership's deep ties to the Capital District community, suggests a sustained ability to capture commercial market share.
- Buffalo/WNY Loan Growth: 14.9% (Q1 2025 YOY).
- Buffalo/WNY Deposit Growth: 82.0% (Q1 2025 YOY).
- Albany/Capital Bank Rank: 5th in C&I loan growth (2024).
Leverage the Enhanced Regulatory Capital from the $45 Million Subordinated Debt Issuance
The $45.0 million subordinated debt issuance in June 2025 is a critical financial maneuver that immediately strengthens your balance sheet and creates a runway for future loan growth. This capital infusion acts as a buffer, allowing you to increase lending without running afoul of regulatory limits, particularly concerning commercial real estate concentration ratios.
Here's the quick math: The entire $45.0 million in 7.75% Fixed-to-Floating Rate Subordinated Notes due 2035 qualifies as Tier 2 capital at the holding company level. More importantly, $37.0 million of this was downstreamed to the Bank, where it qualifies as Tier 1 capital. This strategic repositioning was explicitly designed to enhance your flexibility in funding the strong loan pipelines you are seeing in your key expansion markets. This is a very clear action that directly supports your growth initiatives.
| Capital Component | Amount of Issuance | Regulatory Qualification |
|---|---|---|
| Subordinated Notes Issued (June 2025) | $45.0 million | Tier 2 Capital (Holding Co.) |
| Portion Downstreamed to Bank | $37.0 million | Tier 1 Capital (Bank) |
| Fixed Interest Rate (until June 2030) | 7.75% | Funding Cost |
Potential for Lower Funding Costs and Stimulated Loan Demand if the Federal Reserve Cuts Rates in 2026
A shift in the Federal Reserve's monetary policy in 2026 presents a significant opportunity to improve your net interest margin (NIM) and stimulate loan demand. While the Fed's target rate is currently high, market forecasts suggest the Fed will likely reduce rates 2-3 times through 2026, moving policy toward a more neutral stance. This is a big deal for regional banks like yours.
Rate cuts will lower your cost of funds-the interest you pay on deposits and borrowings-faster than the yield on your loans will fall, which should expand your NIM. Your third quarter 2025 NIM already saw a strong increase to 3.45%, up 40 basis points from the prior quarter, due to balance sheet repositioning. A rate-cutting cycle would further accelerate the decrease in funding costs, especially on interest-bearing deposits. Plus, lower borrowing costs for consumers and businesses will naturally stimulate demand for mortgages, commercial real estate loans, and commercial and industrial (C&I) loans, directly benefiting your robust loan pipelines.
Grow Non-Interest Income Through its CFS Group (Trust, Brokerage, Insurance) Subsidiary
The continued growth of non-interest income, primarily through your CFS Group, is vital for diversifying revenue away from interest rate volatility. CFS Group, which includes your Wealth Management Group (WMG), trust, brokerage, and insurance services, has already demonstrated strong performance in a challenging environment.
In 2024, the WMG had a record year for revenue, increasing its fee income by $1.1 million year-over-year. The CFS Group brokerage arm surpassed $1 million in revenue for the year. Non-interest income for the third quarter of 2025 was $6.1 million, showing that these fee-based services are a consistent revenue stream. Expanding these services in your new, wealthier markets like Buffalo and Albany, where you are already adding new deposit teams, offers a clear cross-selling opportunity. You can use your new commercial lending relationships to introduce business owners to trust and retirement services, a high-margin business line that requires less regulatory capital than balance sheet lending.
Chemung Financial Corporation (CHMG) - SWOT Analysis: Threats
Increased interest expense from the 7.75% fixed-rate subordinated debt issued in June 2025.
You need to be clear-eyed about the cost of capital, and Chemung Financial Corporation's recent debt issuance definitely adds a heavy, fixed expense to the income statement. On June 10, 2025, the company issued $45.0 million in 7.75% Fixed-to-Floating Rate Subordinated Notes due 2035. [cite: 3 from first search, 6 from first search]
Here's the quick math: that 7.75% annual rate translates to a fixed interest expense of approximately $3.49 million per year ($45.0 million x 0.0775). [cite: 2 from first search] For the 2025 fiscal year, you can project an added interest expense of around $1.89 million, as the debt was outstanding for about six and a half months. This new, higher-cost debt is a direct drag on net interest margin (NIM), even if it does bolster Tier 2 capital for regulatory purposes. It's a strategic trade-off, but the immediate impact is a higher cost of funding.
The interest rate is fixed at 7.75% until June 15, 2030. [cite: 2 from first search]
Significant exposure to a potential downturn in the commercial real estate market.
The biggest threat for a regional bank like Chemung Financial Corporation is often concentration risk, and here, the data is unambiguous: Commercial Real Estate (CRE) is the primary engine, but also the main vulnerability. As of September 30, 2025, CRE loans accounted for a significant 61.9% of the total loan balances.
This level of concentration is materially higher than industry averages and creates a single-point-of-failure risk, especially if the broader economic forecast deteriorates. The company has been actively growing this segment, with CRE balances increasing by $80.5 million in the first half of 2025 alone. While management points to a conservative weighted average loan-to-value (LTV) of 58.8%, a sharp, systemic decline in CRE valuations-particularly in the office or retail sectors-could quickly erode that equity cushion.
What this estimate hides is the potential for increased provision for credit losses, which the company already increased to $1.1 million in Q3 2025 due to stronger loan growth and updated CECL (Current Expected Credit Losses) model inputs.
Intense competition from larger regional banks in new expansion territories.
Chemung Financial Corporation's growth strategy hinges on its expansion into the higher-growth Albany (Capital Bank division) and Buffalo (Canal Bank division) markets. The threat here is scale. You are going head-to-head with super-regional banks that have deeper pockets, massive technology budgets, and established brand recognition.
The competition in these markets is fierce. You are competing directly against institutions like KeyBank and Citizens Bank, which operate with a much larger footprint and can afford to offer more aggressive pricing on loans and deposits. For instance, the Western New York Canal Bank division saw a remarkable 82.0% deposit growth in Q1 2025, but maintaining that momentum against larger, entrenched players will require sustained, costly investment in staffing and marketing. [cite: 11 from first search]
The cost of this fight is already visible: total compensation expense increased by 10% year-to-date in 2025, largely attributed to merit raises and staffing for the Western New York expansion. [cite: 13 from first search]
Analyst concerns exist regarding declining revenue growth and profitability margins.
The market is worried about the bank's ability to translate asset growth into sustainable profit, and the 2025 numbers show why. The net profit margin has seen a precipitous drop, falling to 13.8% as of October 2025, a steep decline from 24.5% just a year ago. [cite: 3 from first search]
While the company executed a strategic balance sheet repositioning in Q2 2025, which included selling securities and resulted in a net loss of $6.5 million for the quarter (due to a $17.5 million pre-tax loss on the sale), the underlying trend in earnings is still a concern. Analysts are forecasting the company will remain profitable for the full year, but they still expect declining net income. [cite: 10 from first search] The five-year trend already shows earnings contracting at an average rate of 1.8% per year. [cite: 3 from first search]
This is a profitability problem, not a solvency one. The core challenge is reversing the margin contraction while absorbing higher funding costs from the new subordinated debt and the increased operating expenses from expansion.
| Financial Metric (2025 Data) | Value/Percentage | Context of Threat |
|---|---|---|
| Subordinated Debt Principal | $45.0 million | New fixed liability increasing interest expense. [cite: 2 from first search] |
| Subordinated Debt Fixed Rate | 7.75% | High cost of capital for a regional bank. [cite: 2 from first search] |
| CRE Loan Concentration | 61.9% | Exposure to commercial real estate downturn, well above peer averages. |
| Net Profit Margin (Oct 2025) | 13.8% | Significant decline from 24.5% a year ago, signaling core profitability pressure. [cite: 3 from first search] |
| Q2 2025 Net Loss | $6.5 million | Impact of strategic securities sale (pre-tax loss of $17.5M) on quarterly results. |
| Year-to-Date Compensation Expense Increase | 10% | Cost of expansion in competitive markets like Albany and Buffalo. [cite: 13 from first search] |
Disclaimer
All information, articles, and product details provided on this website are for general informational and educational purposes only. We do not claim any ownership over, nor do we intend to infringe upon, any trademarks, copyrights, logos, brand names, or other intellectual property mentioned or depicted on this site. Such intellectual property remains the property of its respective owners, and any references here are made solely for identification or informational purposes, without implying any affiliation, endorsement, or partnership.
We make no representations or warranties, express or implied, regarding the accuracy, completeness, or suitability of any content or products presented. Nothing on this website should be construed as legal, tax, investment, financial, medical, or other professional advice. In addition, no part of this site—including articles or product references—constitutes a solicitation, recommendation, endorsement, advertisement, or offer to buy or sell any securities, franchises, or other financial instruments, particularly in jurisdictions where such activity would be unlawful.
All content is of a general nature and may not address the specific circumstances of any individual or entity. It is not a substitute for professional advice or services. Any actions you take based on the information provided here are strictly at your own risk. You accept full responsibility for any decisions or outcomes arising from your use of this website and agree to release us from any liability in connection with your use of, or reliance upon, the content or products found herein.