
|
Cherry Hill Mortgage Investment Corporation (CHMI) Avaliação DCF |
Totalmente Editável: Adapte-Se Às Suas Necessidades No Excel Ou Planilhas
Design Profissional: Modelos Confiáveis E Padrão Da Indústria
Pré-Construídos Para Uso Rápido E Eficiente
Compatível com MAC/PC, totalmente desbloqueado
Não É Necessária Experiência; Fácil De Seguir
Cherry Hill Mortgage Investment Corporation (CHMI) Bundle
Procurando determinar o valor intrínseco da Cherry Hill Mortgage Investment Corporation? Nossa calculadora CHMI DCF utiliza dados do mundo real, juntamente com extensas opções de personalização, permitindo ajustar suas previsões e aprimorar suas opções de investimento.
What You Will Receive
- Customizable Excel Template: A fully adjustable Excel-based DCF Calculator featuring pre-filled real CHMI financials.
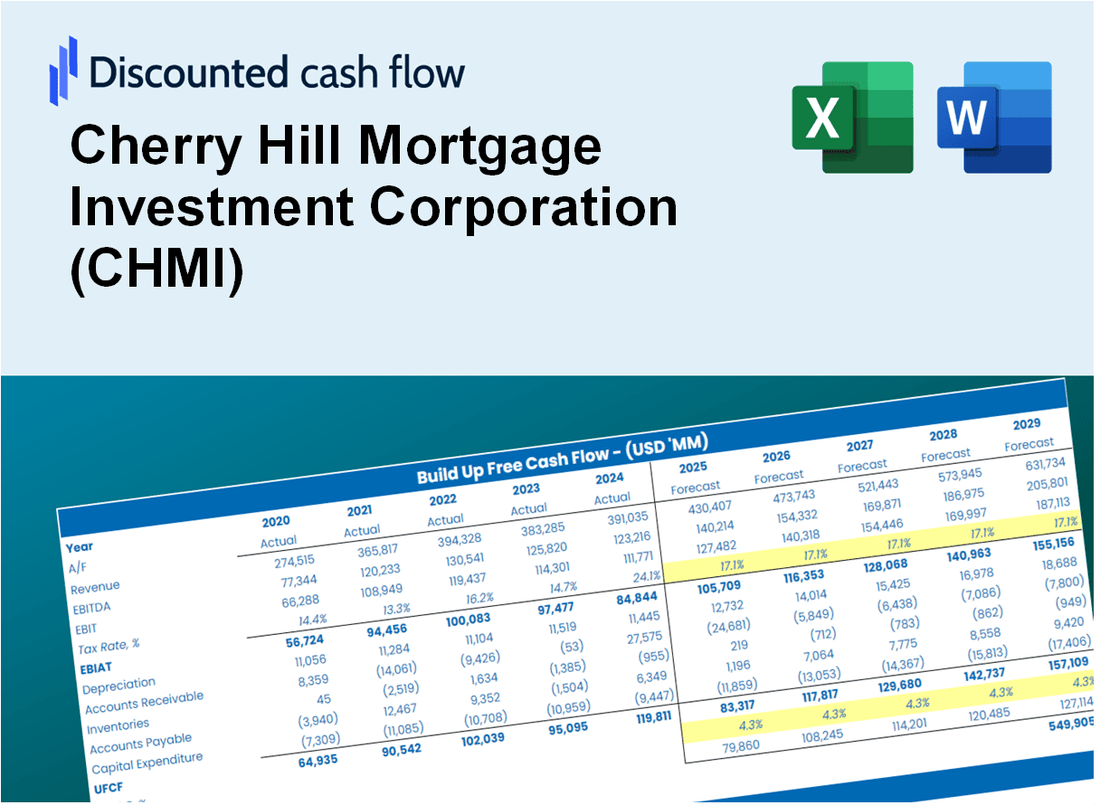
- Accurate Data: Historical data along with forward-looking estimates (highlighted in the yellow cells).
- Forecasting Flexibility: Adjust forecast assumptions such as revenue growth, EBITDA %, and WACC.
- Instant Calculations: Quickly observe how your inputs affect Cherry Hill Mortgage’s valuation.
- Professional Resource: Designed for investors, CFOs, consultants, and financial analysts.
- Intuitive Design: Organized for clarity and usability, complete with step-by-step guidance.
Key Features
- Pre-Loaded Data: Cherry Hill Mortgage Investment Corporation’s (CHMI) historical financial statements and pre-filled forecasts.
- Fully Adjustable Inputs: Customize WACC, tax rates, revenue growth, and EBITDA margins.
- Instant Results: View Cherry Hill’s (CHMI) intrinsic value recalculating in real time.
- Clear Visual Outputs: Dashboard charts showcase valuation results and essential metrics.
- Built for Accuracy: A professional tool designed for analysts, investors, and finance professionals.
How It Works
- Step 1: Download the Excel file for Cherry Hill Mortgage Investment Corporation (CHMI).
- Step 2: Review CHMI’s pre-filled financial data and projections.
- Step 3: Adjust key inputs such as mortgage rates, asset growth, and expense ratios (highlighted cells).
- Step 4: Observe the DCF model refresh in real-time as you modify your assumptions.
- Step 5: Evaluate the results and leverage the insights for your investment strategies.
Why Choose This Calculator for Cherry Hill Mortgage Investment Corporation (CHMI)?
- Accuracy: Utilizes real Cherry Hill financial data to ensure precise calculations.
- Flexibility: Allows users to easily test and adjust inputs as needed.
- Time-Saving: Eliminate the need to create a DCF model from the ground up.
- Professional-Grade: Crafted with the precision and usability expected by CFOs.
- User-Friendly: Intuitive interface suitable for users without extensive financial modeling skills.
Who Should Use This Product?
- Investors: Evaluate Cherry Hill Mortgage Investment Corporation’s (CHMI) performance before making investment decisions.
- CFOs and Financial Analysts: Optimize valuation methods and assess financial projections for mortgage investments.
- Startup Founders: Discover how mortgage investment firms like Cherry Hill are valued in the market.
- Consultants: Provide expert valuation insights and reports for clients in the mortgage sector.
- Students and Educators: Utilize real-world data from Cherry Hill Mortgage Investment Corporation (CHMI) to teach and learn valuation strategies.
What the Template Contains
- Preloaded CHMI Data: Historical and projected financial data, including revenue, net income, and dividend distributions.
- DCF and WACC Models: Professional-grade sheets for calculating intrinsic value and Weighted Average Cost of Capital.
- Editable Inputs: Yellow-highlighted cells for adjusting revenue growth, dividend yields, and discount rates.
- Financial Statements: Comprehensive annual and quarterly financials for deeper analysis.
- Key Ratios: Profitability, liquidity, and efficiency ratios to evaluate performance.
- Dashboard and Charts: Visual summaries of valuation outcomes and assumptions.
Disclaimer
All information, articles, and product details provided on this website are for general informational and educational purposes only. We do not claim any ownership over, nor do we intend to infringe upon, any trademarks, copyrights, logos, brand names, or other intellectual property mentioned or depicted on this site. Such intellectual property remains the property of its respective owners, and any references here are made solely for identification or informational purposes, without implying any affiliation, endorsement, or partnership.
We make no representations or warranties, express or implied, regarding the accuracy, completeness, or suitability of any content or products presented. Nothing on this website should be construed as legal, tax, investment, financial, medical, or other professional advice. In addition, no part of this site—including articles or product references—constitutes a solicitation, recommendation, endorsement, advertisement, or offer to buy or sell any securities, franchises, or other financial instruments, particularly in jurisdictions where such activity would be unlawful.
All content is of a general nature and may not address the specific circumstances of any individual or entity. It is not a substitute for professional advice or services. Any actions you take based on the information provided here are strictly at your own risk. You accept full responsibility for any decisions or outcomes arising from your use of this website and agree to release us from any liability in connection with your use of, or reliance upon, the content or products found herein.