
|
Avaliação DCF CI & T Inc (Cint) |
Totalmente Editável: Adapte-Se Às Suas Necessidades No Excel Ou Planilhas
Design Profissional: Modelos Confiáveis E Padrão Da Indústria
Pré-Construídos Para Uso Rápido E Eficiente
Compatível com MAC/PC, totalmente desbloqueado
Não É Necessária Experiência; Fácil De Seguir
CI&T Inc (CINT) Bundle
Simplifique a avaliação da CI&T Inc (Cint) com esta calculadora DCF personalizável! Com o Real CI&T Inc (Cint) Financeiras e insumos de previsão ajustáveis, você pode testar cenários e descobrir o valor justo da CI & T Inc (CINT) em minutos.
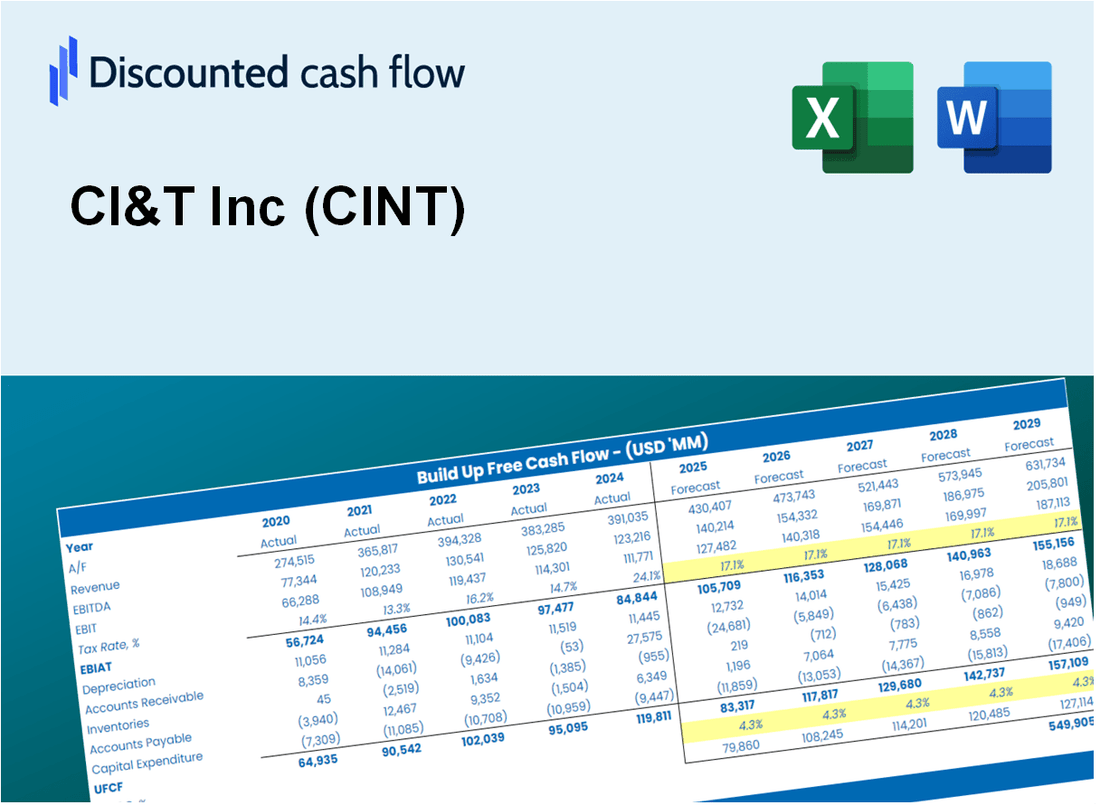
Discounted Cash Flow (DCF) - (USD MM)
| Year | AY1 2020 |
AY2 2021 |
AY3 2022 |
AY4 2023 |
AY5 2024 |
FY1 2025 |
FY2 2026 |
FY3 2027 |
FY4 2028 |
FY5 2029 |
|---|---|---|---|---|---|---|---|---|---|---|
| Revenue | 180.6 | 272.6 | 80.1 | 421.6 | 82.9 | 82.9 | 82.9 | 82.9 | 82.9 | 82.9 |
| Revenue Growth, % | 0 | 51 | -70.64 | 426.63 | -80.35 | 0.00500603 | 0.00500603 | 0.00500603 | 0.00500603 | 0.00500603 |
| EBITDA | 44.0 | 54.5 | 13.8 | 72.9 | 14.2 | 15.9 | 15.9 | 15.9 | 15.9 | 15.9 |
| EBITDA, % | 24.36 | 19.97 | 17.28 | 17.28 | 17.16 | 19.21 | 19.21 | 19.21 | 19.21 | 19.21 |
| Depreciation | 5.6 | 9.1 | 3.5 | 17.6 | 3.2 | 3.1 | 3.1 | 3.1 | 3.1 | 3.1 |
| Depreciation, % | 3.12 | 3.35 | 4.33 | 4.17 | 3.85 | 3.76 | 3.76 | 3.76 | 3.76 | 3.76 |
| EBIT | 38.3 | 45.3 | 10.4 | 55.3 | 11.0 | 12.8 | 12.8 | 12.8 | 12.8 | 12.8 |
| EBIT, % | 21.23 | 16.62 | 12.95 | 13.11 | 13.31 | 15.45 | 15.45 | 15.45 | 15.45 | 15.45 |
| Total Cash | 30.7 | 176.4 | 53.2 | 40.5 | 10.7 | 28.3 | 28.3 | 28.3 | 28.3 | 28.3 |
| Total Cash, percent | .0 | .0 | .0 | .0 | .0 | .0 | .0 | .0 | .0 | .0 |
| Account Receivables | 47.2 | 91.6 | 135.7 | 117.0 | 23.3 | 35.7 | 35.7 | 35.7 | 35.7 | 35.7 |
| Account Receivables, % | 26.14 | 33.61 | 169.51 | 27.74 | 28.13 | 43.12 | 43.12 | 43.12 | 43.12 | 43.12 |
| Inventories | 1.7 | .2 | 5.8 | .0 | .0 | 1.4 | 1.4 | 1.4 | 1.4 | 1.4 |
| Inventories, % | 0.92387 | 0.06203354 | 7.27 | 0 | 0 | 1.65 | 1.65 | 1.65 | 1.65 | 1.65 |
| Accounts Payable | 2.9 | 15.6 | 6.6 | 6.6 | 2.1 | 3.3 | 3.3 | 3.3 | 3.3 | 3.3 |
| Accounts Payable, % | 1.6 | 5.71 | 8.27 | 1.57 | 2.58 | 3.95 | 3.95 | 3.95 | 3.95 | 3.95 |
| Capital Expenditure | -4.0 | -5.6 | -4.3 | -.9 | -2.0 | -2.0 | -2.0 | -2.0 | -2.0 | -2.0 |
| Capital Expenditure, % | -2.24 | -2.07 | -5.42 | -0.21684 | -2.41 | -2.47 | -2.47 | -2.47 | -2.47 | -2.47 |
| Tax Rate, % | 32.61 | 32.61 | 32.61 | 32.61 | 32.61 | 32.61 | 32.61 | 32.61 | 32.61 | 32.61 |
| EBITAT | 25.4 | 27.1 | 5.0 | 35.0 | 7.4 | 7.8 | 7.8 | 7.8 | 7.8 | 7.8 |
| Depreciation | ||||||||||
| Changes in Account Receivables | ||||||||||
| Changes in Inventories | ||||||||||
| Changes in Accounts Payable | ||||||||||
| Capital Expenditure | ||||||||||
| UFCF | -19.0 | .3 | -54.5 | 76.3 | 97.8 | -3.8 | 8.9 | 8.9 | 8.9 | 8.9 |
| WACC, % | 10.52 | 10.35 | 10.03 | 10.45 | 10.56 | 10.38 | 10.38 | 10.38 | 10.38 | 10.38 |
| PV UFCF | ||||||||||
| SUM PV UFCF | 21.9 | |||||||||
| Long Term Growth Rate, % | 2.00 | |||||||||
| Free cash flow (T + 1) | 9 | |||||||||
| Terminal Value | 108 | |||||||||
| Present Terminal Value | 66 | |||||||||
| Enterprise Value | 88 | |||||||||
| Net Debt | 17 | |||||||||
| Equity Value | 71 | |||||||||
| Diluted Shares Outstanding, MM | 137 | |||||||||
| Equity Value Per Share | 0.51 |
What You Will Get
- Editable Excel Template: A fully customizable Excel-based DCF Calculator featuring pre-filled real CI&T Inc (CINT) financials.
- Real-World Data: Historical data and forward-looking estimates (as indicated in the yellow cells).
- Forecast Flexibility: Adjust forecast assumptions such as revenue growth, EBITDA %, and WACC.
- Automatic Calculations: Instantly observe the effect of your inputs on CI&T Inc (CINT)'s valuation.
- Professional Tool: Designed for investors, CFOs, consultants, and financial analysts.
- User-Friendly Design: Organized for clarity and ease of use, complete with step-by-step instructions.
Key Features
- Comprehensive DCF Calculator: Features detailed unlevered and levered DCF valuation frameworks.
- WACC Estimator: Pre-configured Weighted Average Cost of Capital tool with adjustable parameters.
- Customizable Forecast Assumptions: Adjust growth projections, capital expenditures, and discount rates as needed.
- Integrated Financial Ratios: Evaluate profitability, leverage, and efficiency ratios specifically for CI&T Inc (CINT).
- User-Friendly Dashboard and Charts: Visual representations highlight essential valuation metrics for straightforward analysis.
How It Works
- Step 1: Download the Excel file.
- Step 2: Review pre-entered CI&T Inc (CINT) data (historical and projected).
- Step 3: Adjust key assumptions (yellow cells) based on your analysis.
- Step 4: View automatic recalculations for CI&T Inc (CINT)’s intrinsic value.
- Step 5: Use the outputs for investment decisions or reporting.
Why Choose CI&T Inc (CINT)?
- Streamlined Processes: Quickly access comprehensive solutions without starting from zero.
- Enhanced Precision: Utilize dependable data and methodologies to minimize valuation discrepancies.
- Completely Adaptable: Modify the framework to align with your unique insights and forecasts.
- Intuitive Insights: User-friendly visuals and outputs facilitate straightforward analysis of results.
- Preferred by Professionals: Crafted for experts who prioritize accuracy and ease of use.
Who Should Use This Product?
- Finance Students: Master financial modeling techniques and apply them using real-time data for CI&T Inc (CINT).
- Academics: Integrate industry-standard models into your research or teaching related to CI&T Inc (CINT).
- Investors: Validate your investment strategies and assess valuation projections for CI&T Inc (CINT).
- Analysts: Enhance your analysis with a ready-to-use, adaptable DCF model tailored for CI&T Inc (CINT).
- Small Business Owners: Understand the valuation practices used for public companies like CI&T Inc (CINT).
What the Template Contains
- Preloaded CINT Data: Historical and projected financial information, including revenue, EBIT, and capital expenditures.
- DCF and WACC Models: Advanced sheets for calculating intrinsic value and Weighted Average Cost of Capital.
- Editable Inputs: Yellow-highlighted cells for modifying revenue growth, tax rates, and discount rates.
- Financial Statements: Detailed annual and quarterly financials for in-depth analysis.
- Key Ratios: Profitability, leverage, and efficiency ratios for performance evaluation.
- Dashboard and Charts: Visual representations of valuation results and underlying assumptions.
Disclaimer
All information, articles, and product details provided on this website are for general informational and educational purposes only. We do not claim any ownership over, nor do we intend to infringe upon, any trademarks, copyrights, logos, brand names, or other intellectual property mentioned or depicted on this site. Such intellectual property remains the property of its respective owners, and any references here are made solely for identification or informational purposes, without implying any affiliation, endorsement, or partnership.
We make no representations or warranties, express or implied, regarding the accuracy, completeness, or suitability of any content or products presented. Nothing on this website should be construed as legal, tax, investment, financial, medical, or other professional advice. In addition, no part of this site—including articles or product references—constitutes a solicitation, recommendation, endorsement, advertisement, or offer to buy or sell any securities, franchises, or other financial instruments, particularly in jurisdictions where such activity would be unlawful.
All content is of a general nature and may not address the specific circumstances of any individual or entity. It is not a substitute for professional advice or services. Any actions you take based on the information provided here are strictly at your own risk. You accept full responsibility for any decisions or outcomes arising from your use of this website and agree to release us from any liability in connection with your use of, or reliance upon, the content or products found herein.