
|
Cullman Bancorp, Inc. (Cull) Avaliação DCF |
Totalmente Editável: Adapte-Se Às Suas Necessidades No Excel Ou Planilhas
Design Profissional: Modelos Confiáveis E Padrão Da Indústria
Pré-Construídos Para Uso Rápido E Eficiente
Compatível com MAC/PC, totalmente desbloqueado
Não É Necessária Experiência; Fácil De Seguir
Cullman Bancorp, Inc. (CULL) Bundle
Procurando determinar o valor intrínseco de Cullman Bancorp, Inc.? Nossa calculadora DCF Cull integra dados do mundo real com extensas opções de personalização, permitindo refinar suas previsões e aprimorar suas opções de investimento.
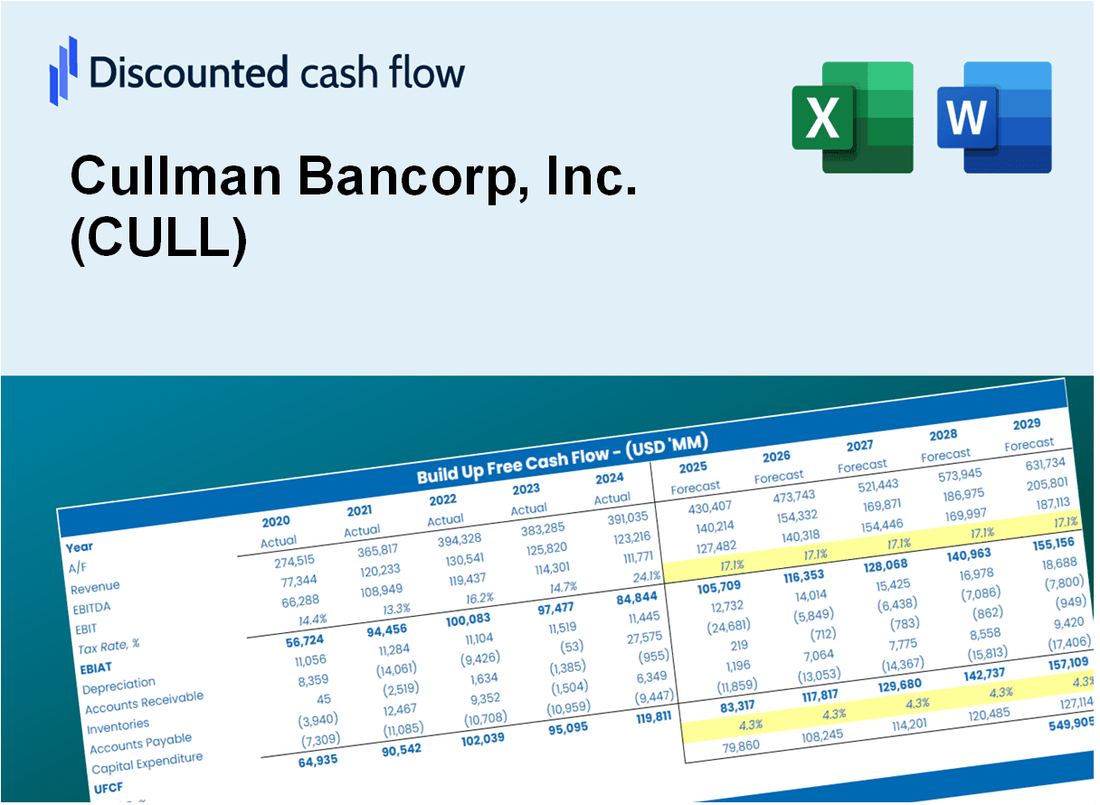
Discounted Cash Flow (DCF) - (USD MM)
| Year | AY1 2020 |
AY2 2021 |
AY3 2022 |
AY4 2023 |
AY5 2024 |
FY1 2025 |
FY2 2026 |
FY3 2027 |
FY4 2028 |
FY5 2029 |
|---|---|---|---|---|---|---|---|---|---|---|
| Revenue | 15.6 | 14.9 | 18.2 | 21.0 | 23.2 | 25.8 | 28.6 | 31.7 | 35.1 | 39.0 |
| Revenue Growth, % | 0 | -4.75 | 22.42 | 15.52 | 10.4 | 10.9 | 10.9 | 10.9 | 10.9 | 10.9 |
| EBITDA | 5.1 | 2.5 | 5.6 | .0 | 4.4 | 5.1 | 5.7 | 6.3 | 7.0 | 7.7 |
| EBITDA, % | 32.52 | 16.94 | 30.85 | 0 | 18.84 | 19.83 | 19.83 | 19.83 | 19.83 | 19.83 |
| Depreciation | .6 | .5 | .3 | .5 | .0 | .6 | .6 | .7 | .8 | .9 |
| Depreciation, % | 3.69 | 3.18 | 1.84 | 2.23 | 0 | 2.19 | 2.19 | 2.19 | 2.19 | 2.19 |
| EBIT | 4.5 | 2.0 | 5.3 | -.5 | 4.4 | 4.5 | 5.0 | 5.6 | 6.2 | 6.9 |
| EBIT, % | 28.83 | 13.76 | 29.01 | -2.23 | 18.84 | 17.64 | 17.64 | 17.64 | 17.64 | 17.64 |
| Total Cash | 22.0 | 23.5 | 36.6 | 32.7 | .0 | 20.6 | 22.9 | 25.3 | 28.1 | 31.2 |
| Total Cash, percent | .0 | .0 | .0 | .0 | .0 | .0 | .0 | .0 | .0 | .0 |
| Account Receivables | 1.0 | .8 | 1.2 | 1.3 | .0 | 1.2 | 1.4 | 1.5 | 1.7 | 1.9 |
| Account Receivables, % | 6.41 | 5.21 | 6.38 | 5.99 | 0 | 4.8 | 4.8 | 4.8 | 4.8 | 4.8 |
| Inventories | .0 | .0 | .0 | .0 | .0 | .0 | .0 | .0 | .0 | .0 |
| Inventories, % | 0 | 0 | 0 | 0 | 0 | 0 | 0 | 0 | 0 | 0 |
| Accounts Payable | .1 | .1 | .2 | .2 | .0 | .2 | .2 | .2 | .2 | .2 |
| Accounts Payable, % | 0.64016 | 0.40325 | 0.85095 | 1.14 | 0 | 0.60604 | 0.60604 | 0.60604 | 0.60604 | 0.60604 |
| Capital Expenditure | -.4 | -1.3 | -1.7 | -3.6 | -3.8 | -2.8 | -3.1 | -3.5 | -3.9 | -4.3 |
| Capital Expenditure, % | -2.75 | -8.77 | -9.57 | -17.25 | -16.51 | -10.97 | -10.97 | -10.97 | -10.97 | -10.97 |
| Tax Rate, % | 21.89 | 21.89 | 21.89 | 21.89 | 21.89 | 21.89 | 21.89 | 21.89 | 21.89 | 21.89 |
| EBITAT | 3.5 | 1.7 | 4.2 | -.4 | 3.4 | 3.6 | 4.0 | 4.4 | 4.9 | 5.5 |
| Depreciation | ||||||||||
| Changes in Account Receivables | ||||||||||
| Changes in Inventories | ||||||||||
| Changes in Accounts Payable | ||||||||||
| Capital Expenditure | ||||||||||
| UFCF | 2.8 | 1.1 | 2.5 | -3.5 | .6 | .3 | 1.4 | 1.5 | 1.7 | 1.9 |
| WACC, % | 4.04 | 4.11 | 4.05 | 4.04 | 4.04 | 4.06 | 4.06 | 4.06 | 4.06 | 4.06 |
| PV UFCF | ||||||||||
| SUM PV UFCF | 5.9 | |||||||||
| Long Term Growth Rate, % | 2.00 | |||||||||
| Free cash flow (T + 1) | 2 | |||||||||
| Terminal Value | 94 | |||||||||
| Present Terminal Value | 77 | |||||||||
| Enterprise Value | 83 | |||||||||
| Net Debt | 45 | |||||||||
| Equity Value | 38 | |||||||||
| Diluted Shares Outstanding, MM | 7 | |||||||||
| Equity Value Per Share | 5.75 |
What You Will Get
- Real Cullman Bancorp Data: Preloaded financials – from revenue to EBIT – based on actual and projected figures.
- Full Customization: Adjust all critical parameters (yellow cells) like WACC, growth %, and tax rates.
- Instant Valuation Updates: Automatic recalculations to analyze the impact of changes on Cullman Bancorp’s fair value.
- Versatile Excel Template: Tailored for quick edits, scenario testing, and detailed projections.
- Time-Saving and Accurate: Skip building models from scratch while maintaining precision and flexibility.
Key Features
- Customizable Financial Inputs: Adjust essential metrics such as loan growth, net interest margin, and operating expenses.
- Instant DCF Valuation: Provides immediate calculations of intrinsic value, NPV, and additional financial metrics.
- High-Precision Accuracy: Leverages Cullman Bancorp's actual financial data for trustworthy valuation results.
- Effortless Scenario Analysis: Easily evaluate various assumptions and analyze the resulting impacts.
- Efficiency Booster: Avoid the hassle of constructing intricate valuation models from the ground up.
How It Works
- Download: Obtain the pre-built Excel file featuring Cullman Bancorp, Inc.'s (CULL) financial data.
- Customize: Tailor your forecasts, including revenue growth, EBITDA %, and WACC.
- Update Automatically: The intrinsic value and NPV calculations refresh in real-time.
- Test Scenarios: Develop various projections and compare results instantly.
- Make Decisions: Leverage the valuation outcomes to inform your investment strategy.
Why Choose This Calculator for Cullman Bancorp, Inc. (CULL)?
- Comprehensive Tool: Offers DCF, WACC, and financial ratio analyses all in one solution.
- Customizable Inputs: Modify the yellow-highlighted cells to explore different financial scenarios.
- Detailed Insights: Automatically computes Cullman Bancorp’s intrinsic value and Net Present Value.
- Preloaded Data: Historical and projected data provide reliable starting points for analysis.
- Professional Quality: Perfect for financial analysts, investors, and business advisors focusing on (CULL).
Who Should Use This Product?
- Investors: Evaluate Cullman Bancorp, Inc.'s (CULL) performance before making investment decisions.
- CFOs and Financial Analysts: Enhance financial analysis and refine valuation methodologies.
- Startup Founders: Understand the valuation strategies of established financial institutions like Cullman Bancorp, Inc. (CULL).
- Consultants: Provide comprehensive valuation insights and reports for your clients.
- Students and Educators: Utilize authentic financial data to explore and teach valuation principles.
What the Template Contains
- Operating and Balance Sheet Data: Pre-filled Cullman Bancorp, Inc. (CULL) historical data and forecasts, including revenue, EBITDA, EBIT, and capital expenditures.
- WACC Calculation: A dedicated sheet for Weighted Average Cost of Capital (WACC), including parameters like Beta, risk-free rate, and share price.
- DCF Valuation (Unlevered and Levered): Editable Discounted Cash Flow models showing intrinsic value with detailed calculations.
- Financial Statements: Pre-loaded financial statements (annual and quarterly) to support analysis.
- Key Ratios: Includes profitability, leverage, and efficiency ratios for Cullman Bancorp, Inc. (CULL).
- Dashboard and Charts: Visual summary of valuation outputs and assumptions to analyze results easily.
Disclaimer
All information, articles, and product details provided on this website are for general informational and educational purposes only. We do not claim any ownership over, nor do we intend to infringe upon, any trademarks, copyrights, logos, brand names, or other intellectual property mentioned or depicted on this site. Such intellectual property remains the property of its respective owners, and any references here are made solely for identification or informational purposes, without implying any affiliation, endorsement, or partnership.
We make no representations or warranties, express or implied, regarding the accuracy, completeness, or suitability of any content or products presented. Nothing on this website should be construed as legal, tax, investment, financial, medical, or other professional advice. In addition, no part of this site—including articles or product references—constitutes a solicitation, recommendation, endorsement, advertisement, or offer to buy or sell any securities, franchises, or other financial instruments, particularly in jurisdictions where such activity would be unlawful.
All content is of a general nature and may not address the specific circumstances of any individual or entity. It is not a substitute for professional advice or services. Any actions you take based on the information provided here are strictly at your own risk. You accept full responsibility for any decisions or outcomes arising from your use of this website and agree to release us from any liability in connection with your use of, or reliance upon, the content or products found herein.